## Line Chart: Accuracy vs. Model Size for Two Decoding Methods
### Overview
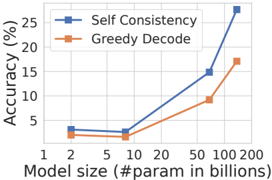
The image is a line chart comparing the performance (accuracy) of two decoding methods—"Self Consistency" and "Greedy Decode"—across a range of model sizes. The chart demonstrates how accuracy scales with the number of parameters in the model.
### Components/Axes
* **Chart Type:** Line chart with markers.
* **X-Axis (Horizontal):**
* **Title:** `Model size (#param in billions)`
* **Scale:** Logarithmic (base 10).
* **Tick Labels/Markers:** 1, 2, 5, 10, 20, 50, 100, 200.
* **Y-Axis (Vertical):**
* **Title:** `Accuracy (%)`
* **Scale:** Linear.
* **Range:** 0 to 30.
* **Tick Labels:** 0, 5, 10, 15, 20, 25, 30.
* **Legend:**
* **Position:** Top-left corner of the plot area.
* **Entry 1:** `Self Consistency` - Represented by a blue line with square markers.
* **Entry 2:** `Greedy Decode` - Represented by an orange line with triangle markers.
* **Background:** Light gray grid lines are present.
### Detailed Analysis
**Data Series 1: Self Consistency (Blue line, square markers)**
* **Visual Trend:** The line shows a gradual, shallow increase from 1B to 10B parameters, followed by a steep, accelerating upward slope from 20B to 100B parameters.
* **Approximate Data Points:**
* At 1B params: ~3% accuracy
* At 2B params: ~3% accuracy
* At 5B params: ~4% accuracy
* At 10B params: ~5% accuracy
* At 20B params: ~8% accuracy
* At 50B params: ~15% accuracy
* At 100B params: ~27% accuracy
**Data Series 2: Greedy Decode (Orange line, triangle markers)**
* **Visual Trend:** The line shows a steady, moderate upward slope across the entire range of model sizes. The rate of increase is more consistent and less dramatic than the Self Consistency line.
* **Approximate Data Points:**
* At 1B params: ~2% accuracy
* At 2B params: ~2% accuracy
* At 5B params: ~3% accuracy
* At 10B params: ~4% accuracy
* At 20B params: ~6% accuracy
* At 50B params: ~10% accuracy
* At 100B params: ~17% accuracy
### Key Observations
1. **Performance Gap:** The "Self Consistency" method consistently achieves higher accuracy than "Greedy Decode" at every model size shown.
2. **Diverging Trends:** The performance gap between the two methods widens significantly as model size increases. At 1B parameters, the difference is ~1 percentage point. At 100B parameters, the difference is ~10 percentage points.
3. **Scaling Behavior:** The "Self Consistency" line exhibits a "hockey stick" or exponential-like growth curve, particularly after the 20B parameter mark. The "Greedy Decode" line shows more linear growth on this log-linear plot.
4. **Critical Threshold:** The most dramatic acceleration in accuracy for "Self Consistency" occurs between 20B and 100B parameters.
### Interpretation
The chart provides strong evidence that the **Self Consistency decoding method scales more effectively with model size than Greedy Decode**. While both methods improve as models grow larger, the benefit of using Self Consistency becomes disproportionately greater for very large models (50B+ parameters).
This suggests that the computational overhead or sampling strategy inherent to Self Consistency is particularly well-suited to leveraging the increased capacity and potential reasoning capabilities of large-scale models. The data implies that for state-of-the-art performance at the largest scales, employing a method like Self Consistency is not just beneficial but may be critical, as the performance gap becomes substantial. The chart does not show data beyond 100B parameters, leaving open the question of whether this divergent trend continues.