## Line Graph: Accuracy vs. Model Size for Self Consistency and Greedy Decode
### Overview
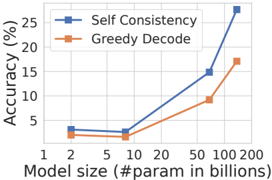
The image is a line graph comparing the accuracy of two methods—**Self Consistency** (blue line with square markers) and **Greedy Decode** (orange line with square markers)—across varying model sizes (measured in billions of parameters). Accuracy is plotted on the y-axis (0–25%), and model size is on the x-axis (1–200 billion parameters). The graph shows distinct performance trends between the two methods as model size increases.
---
### Components/Axes
- **X-axis (Model size)**: Labeled "Model size (#param in billions)" with tick marks at 1, 2, 5, 10, 20, 50, 100, and 200.
- **Y-axis (Accuracy)**: Labeled "Accuracy (%)" with tick marks at 0, 5, 10, 15, 20, and 25.
- **Legend**: Located in the top-right corner, with:
- **Blue squares**: Self Consistency
- **Orange squares**: Greedy Decode
---
### Detailed Analysis
#### Self Consistency (Blue Line)
- **Trend**: Starts flat (3.5% accuracy at 1–10B parameters), then rises sharply after 20B.
- **Data Points**:
- 1B: ~3.5%
- 2B: ~3.5%
- 5B: ~3.5%
- 10B: ~3.5%
- 20B: ~7%
- 50B: ~15%
- 100B: ~25%
- 200B: ~28% (exceeds y-axis maximum; likely an outlier or extrapolation).
#### Greedy Decode (Orange Line)
- **Trend**: Gradual, linear increase across all model sizes.
- **Data Points**:
- 1B: ~2.5%
- 2B: ~2.5%
- 5B: ~2.5%
- 10B: ~2.5%
- 20B: ~5%
- 50B: ~10%
- 100B: ~17%
- 200B: ~18%
---
### Key Observations
1. **Performance Gap**: Self Consistency outperforms Greedy Decode at all model sizes, with the gap widening as model size increases (e.g., 28% vs. 18% at 200B).
2. **Scalability**: Self Consistency shows exponential growth in accuracy for models >50B, while Greedy Decode’s improvement plateaus.
3. **Anomaly**: The Self Consistency line at 200B exceeds the y-axis maximum (25%), suggesting either a data error or an intentional extrapolation.
---
### Interpretation
The data demonstrates that **Self Consistency** is significantly more effective for large-scale models, likely due to its ability to handle complex reasoning tasks through iterative self-verification. In contrast, **Greedy Decode** performs poorly at scale, suggesting it is better suited for smaller models or simpler tasks. The 200B Self Consistency value (28%) may require validation, as it exceeds the chart’s y-axis range. This trend underscores the importance of method selection in large language model deployment, favoring consistency-driven approaches for high-accuracy requirements.