## Heatmap: Correlation Heatmap of Reward Functions
### Overview
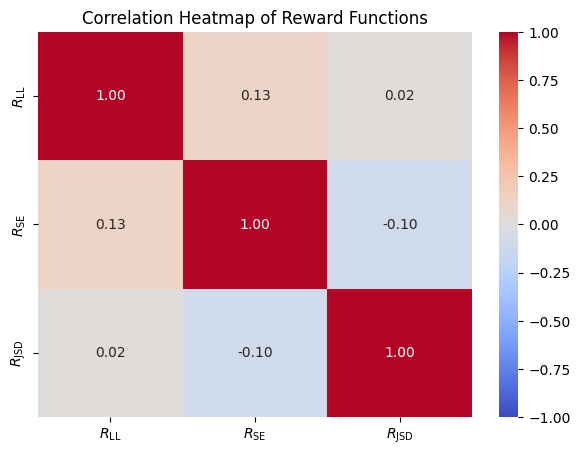
This heatmap visualizes the pairwise correlation coefficients between three reward functions: **R_LL**, **R_SE**, and **R_JSD**. The color gradient ranges from red (positive correlation) to blue (negative correlation), with white indicating no correlation. The diagonal cells are fixed at 1.00, representing perfect self-correlation.
### Components/Axes
- **X-axis (Columns)**: R_LL, R_SE, R_JSD
- **Y-axis (Rows)**: R_LL, R_SE, R_JSD
- **Color Scale**:
- Red → 1.00 (perfect positive correlation)
- Blue → -1.00 (perfect negative correlation)
- White → 0.00 (no correlation)
- **Legend**: Positioned on the right, with a vertical gradient from red (top) to blue (bottom).
### Detailed Analysis
| Row\Column | R_LL | R_SE | R_JSD |
|------------|--------|--------|--------|
| **R_LL** | 1.00 | 0.13 | 0.02 |
| **R_SE** | 0.13 | 1.00 | -0.10 |
| **R_JSD** | 0.02 | -0.10 | 1.00 |
- **R_LL**:
- Self-correlation: 1.00 (red).
- Correlation with R_SE: 0.13 (light red, weak positive).
- Correlation with R_JSD: 0.02 (gray, near-neutral).
- **R_SE**:
- Self-correlation: 1.00 (red).
- Correlation with R_LL: 0.13 (light red, weak positive).
- Correlation with R_JSD: -0.10 (light blue, weak negative).
- **R_JSD**:
- Self-correlation: 1.00 (red).
- Correlation with R_LL: 0.02 (gray, near-neutral).
- Correlation with R_SE: -0.10 (light blue, weak negative).
### Key Observations
1. **Diagonal Dominance**: All diagonal cells are 1.00, as expected for self-correlation.
2. **Weak Pairwise Correlations**:
- R_LL and R_SE show a weak positive correlation (0.13).
- R_SE and R_JSD exhibit a weak negative correlation (-0.10).
- R_LL and R_JSD are nearly uncorrelated (0.02).
3. **Symmetry**: The heatmap is symmetric along the diagonal, consistent with correlation properties.
### Interpretation
The heatmap suggests that the three reward functions (**R_LL**, **R_SE**, **R_JSD**) are largely **independent**, with only minor pairwise correlations. The weak positive correlation between R_LL and R_SE (0.13) and the weak negative correlation between R_SE and R_JSD (-0.10) imply subtle trade-offs or complementary relationships. However, the near-zero correlation between R_LL and R_JSD (0.02) indicates these functions operate in largely distinct domains. This could reflect divergent design objectives or optimization targets in the underlying system. The absence of strong correlations highlights the need for careful balancing when combining these reward functions in multi-objective optimization scenarios.