## Chart Type: Correlation Heatmap
### Overview
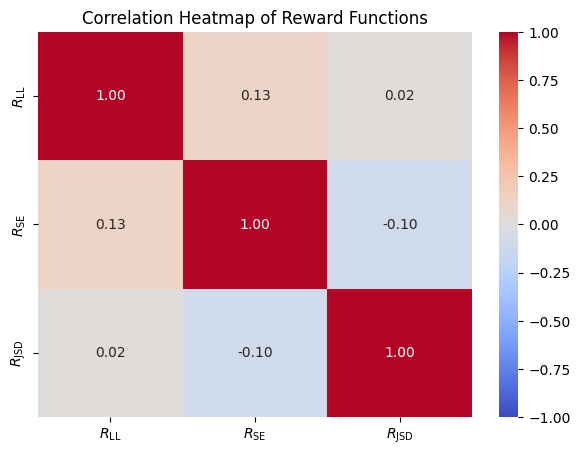
The image is a correlation heatmap visualizing the relationships between three reward functions: R_LL, R_SE, and R_JSD. The heatmap uses a color gradient from blue (-1.00) to red (1.00) to represent the correlation coefficients. The values are also explicitly stated within each cell of the heatmap.
### Components/Axes
* **Title:** Correlation Heatmap of Reward Functions
* **X-axis:** R_LL, R_SE, R_JSD
* **Y-axis:** R_LL, R_SE, R_JSD
* **Colorbar:** Ranges from -1.00 (blue) to 1.00 (red), with intermediate values indicated (e.g., -0.75, -0.50, -0.25, 0.00, 0.25, 0.50, 0.75).
### Detailed Analysis
The heatmap displays the correlation coefficients between the reward functions.
* **R_LL vs. R_LL:** 1.00 (red)
* **R_LL vs. R_SE:** 0.13 (light orange)
* **R_LL vs. R_JSD:** 0.02 (light gray)
* **R_SE vs. R_LL:** 0.13 (light orange)
* **R_SE vs. R_SE:** 1.00 (red)
* **R_SE vs. R_JSD:** -0.10 (light blue)
* **R_JSD vs. R_LL:** 0.02 (light gray)
* **R_JSD vs. R_SE:** -0.10 (light blue)
* **R_JSD vs. R_JSD:** 1.00 (red)
### Key Observations
* The diagonal elements (R_LL vs. R_LL, R_SE vs. R_SE, R_JSD vs. R_JSD) are all 1.00, indicating perfect positive correlation (as expected).
* R_LL and R_SE have a weak positive correlation of 0.13.
* R_LL and R_JSD have a very weak positive correlation of 0.02.
* R_SE and R_JSD have a weak negative correlation of -0.10.
### Interpretation
The heatmap reveals the relationships between the three reward functions. R_LL and R_SE are weakly positively correlated, while R_SE and R_JSD are weakly negatively correlated. R_LL and R_JSD show almost no correlation. This suggests that R_SE might capture different aspects of the reward compared to R_LL and R_JSD, and that R_LL and R_JSD are relatively independent. The heatmap provides a visual and quantitative summary of the interdependencies between these reward functions, which could be useful in designing or selecting appropriate reward functions for a given task.