\n
## Heatmap: Correlation Heatmap of Reward Functions
### Overview
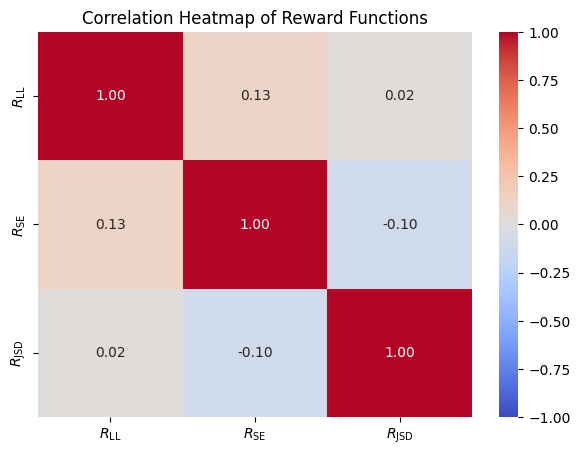
The image presents a correlation heatmap visualizing the relationships between three reward functions: R<sub>LL</sub>, R<sub>SE</sub>, and R<sub>SD</sub>. The heatmap uses a color gradient to represent correlation coefficients, ranging from -1.00 (blue) to 1.00 (red).
### Components/Axes
* **Title:** "Correlation Heatmap of Reward Functions" (top-center)
* **X-axis Labels:** R<sub>LL</sub>, R<sub>SE</sub>, R<sub>SD</sub> (bottom)
* **Y-axis Labels:** R<sub>LL</sub>, R<sub>SE</sub>, R<sub>SD</sub> (left)
* **Color Legend:** Located in the top-right corner, ranging from blue (-1.00) to red (1.00), with intermediate values marked at -0.75, -0.50, -0.25, 0.25, 0.50, 0.75.
### Detailed Analysis
The heatmap displays the correlation coefficients between each pair of reward functions.
* **R<sub>LL</sub> vs. R<sub>LL</sub>:** 1.00 (dark red, top-left cell) - Perfect positive correlation.
* **R<sub>LL</sub> vs. R<sub>SE</sub>:** 0.13 (light red, top-middle cell) - Weak positive correlation.
* **R<sub>LL</sub> vs. R<sub>SD</sub>:** 0.02 (very light red, top-right cell) - Very weak positive correlation.
* **R<sub>SE</sub> vs. R<sub>LL</sub>:** 0.13 (light red, middle-left cell) - Weak positive correlation.
* **R<sub>SE</sub> vs. R<sub>SE</sub>:** 1.00 (dark red, middle-center cell) - Perfect positive correlation.
* **R<sub>SE</sub> vs. R<sub>SD</sub>:** -0.10 (light blue, middle-right cell) - Weak negative correlation.
* **R<sub>SD</sub> vs. R<sub>LL</sub>:** 0.02 (very light red, bottom-left cell) - Very weak positive correlation.
* **R<sub>SD</sub> vs. R<sub>SE</sub>:** -0.10 (light blue, bottom-middle cell) - Weak negative correlation.
* **R<sub>SD</sub> vs. R<sub>SD</sub>:** 1.00 (dark red, bottom-right cell) - Perfect positive correlation.
### Key Observations
* Each reward function has a perfect positive correlation with itself (diagonal cells are all 1.00).
* R<sub>LL</sub> and R<sub>SE</sub> exhibit a weak positive correlation.
* R<sub>SE</sub> and R<sub>SD</sub> show a weak negative correlation.
* The correlations between R<sub>LL</sub> and R<sub>SD</sub> are very close to zero, indicating almost no linear relationship.
### Interpretation
The heatmap reveals the degree of linear association between the three reward functions. The strong positive correlations along the diagonal are expected, as each function is perfectly correlated with itself. The weak positive correlation between R<sub>LL</sub> and R<sub>SE</sub> suggests that when R<sub>LL</sub> increases, R<sub>SE</sub> tends to increase slightly, but the relationship is not strong. The weak negative correlation between R<sub>SE</sub> and R<sub>SD</sub> indicates that as R<sub>SE</sub> increases, R<sub>SD</sub> tends to decrease slightly. The near-zero correlation between R<sub>LL</sub> and R<sub>SD</sub> suggests these two reward functions are largely independent of each other in a linear sense.
This information is valuable for understanding how these reward functions might interact when used in a reinforcement learning or optimization context. If the reward functions are highly correlated, they may provide redundant signals, while uncorrelated functions may offer more diverse information to the learning agent. The heatmap provides a concise visual summary of these relationships.