## Heatmap: Cosine Similarity Across Frequency Bands and Models
### Overview
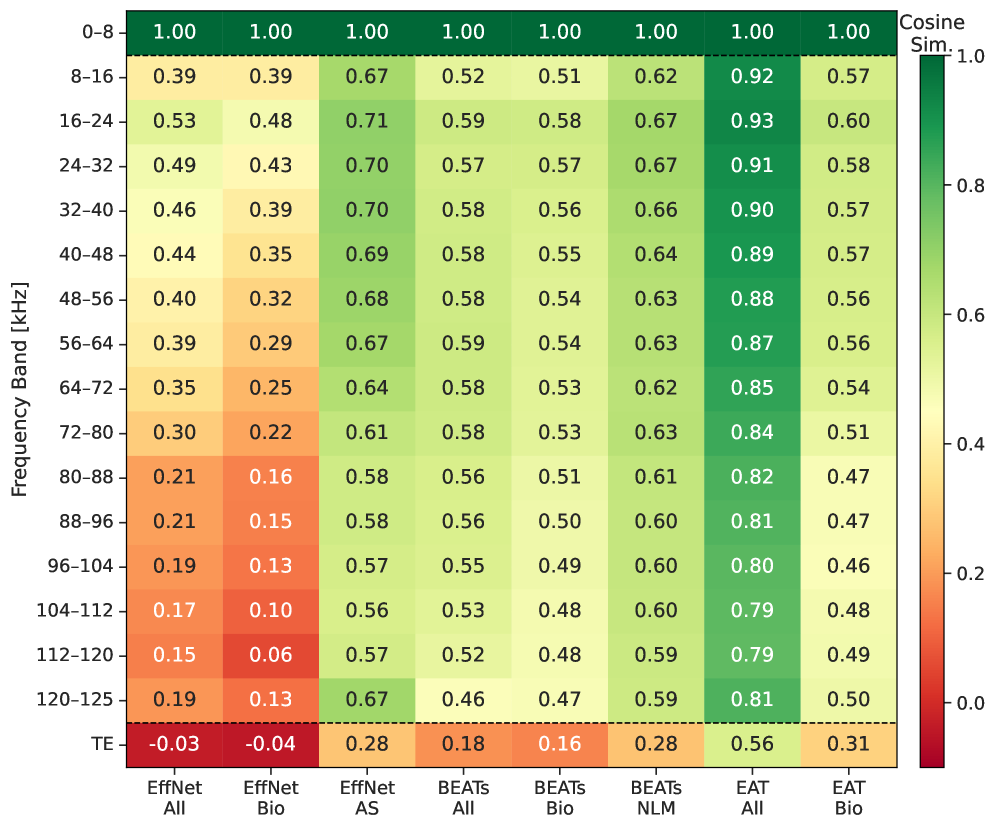
The image is a heatmap visualizing cosine similarity values between different audio processing models (EffNet, BEATs, EAT) and frequency bands (0-8 kHz to 120-125 kHz). The color scale ranges from red (low similarity, ~0.0) to green (high similarity, ~1.0). A "TE" row at the bottom contains negative values, suggesting a distinct metric or anomaly.
### Components/Axes
- **X-axis (Models/Datasets)**:
EffNet All, EffNet Bio, EffNet AS, BEATs All, BEATs Bio, BEATs NLM, EAT All, EAT Bio.
- **Y-axis (Frequency Bands)**:
0-8 kHz, 8-16 kHz, 16-24 kHz, 24-32 kHz, 32-40 kHz, 40-48 kHz, 48-56 kHz, 56-64 kHz, 64-72 kHz, 72-80 kHz, 80-88 kHz, 88-96 kHz, 96-104 kHz, 104-112 kHz, 112-120 kHz, 120-125 kHz, TE.
- **Legend**:
Color gradient from red (0.0) to green (1.0), labeled "Cosine Sim."
### Detailed Analysis
- **Frequency Bands**:
- **0-8 kHz**: All values are 1.00 (green), indicating perfect similarity within this band.
- **8-16 kHz**: Values range from 0.39 (EffNet Bio) to 0.92 (EAT All).
- **16-24 kHz**: Values range from 0.48 (EffNet Bio) to 0.93 (EAT All).
- **24-32 kHz**: Values range from 0.43 (EffNet Bio) to 0.91 (EAT All).
- **32-40 kHz**: Values range from 0.39 (EffNet Bio) to 0.90 (EAT All).
- **40-48 kHz**: Values range from 0.35 (EffNet Bio) to 0.89 (EAT All).
- **48-56 kHz**: Values range from 0.32 (EffNet Bio) to 0.88 (EAT All).
- **56-64 kHz**: Values range from 0.29 (EffNet Bio) to 0.87 (EAT All).
- **64-72 kHz**: Values range from 0.25 (EffNet Bio) to 0.85 (EAT All).
- **72-80 kHz**: Values range from 0.22 (EffNet Bio) to 0.84 (EAT All).
- **80-88 kHz**: Values range from 0.16 (EffNet Bio) to 0.82 (EAT All).
- **88-96 kHz**: Values range from 0.15 (EffNet Bio) to 0.81 (EAT All).
- **96-104 kHz**: Values range from 0.13 (EffNet Bio) to 0.80 (EAT All).
- **104-112 kHz**: Values range from 0.10 (EffNet Bio) to 0.79 (EAT All).
- **112-120 kHz**: Values range from 0.06 (EffNet Bio) to 0.79 (EAT All).
- **120-125 kHz**: Values range from 0.13 (EffNet Bio) to 0.81 (EAT All).
- **TE**: Contains negative values (-0.03 to -0.04), suggesting a distinct metric or error.
- **Models/Datasets**:
- **EffNet All**: Consistently high similarity (1.00) in 0-8 kHz, decreasing to 0.19 in 120-125 kHz.
- **EffNet Bio**: Lower similarity across all bands (e.g., 0.39 in 8-16 kHz, 0.06 in 112-120 kHz).
- **EffNet AS**: Moderate similarity (e.g., 0.67 in 8-16 kHz, 0.67 in 120-125 kHz).
- **BEATs All**: High similarity (e.g., 0.52 in 8-16 kHz, 0.46 in 120-125 kHz).
- **BEATs Bio**: Lower similarity (e.g., 0.16 in 80-88 kHz, 0.47 in 120-125 kHz).
- **BEATs NLM**: Moderate similarity (e.g., 0.60 in 8-16 kHz, 0.59 in 120-125 kHz).
- **EAT All**: Highest similarity in most bands (e.g., 0.92 in 8-16 kHz, 0.81 in 120-125 kHz).
- **EAT Bio**: Moderate similarity (e.g., 0.57 in 8-16 kHz, 0.50 in 120-125 kHz).
### Key Observations
1. **Frequency Band Trends**:
- Similarity decreases with increasing frequency bands for most models.
- **EAT All** maintains the highest similarity across all bands, while **EffNet Bio** shows the lowest.
- The **TE** row contains negative values, which deviate from the rest of the data.
2. **Model Performance**:
- **EAT All** and **EffNet All** exhibit the highest similarity in lower frequency bands (0-8 kHz).
- **BEATs NLM** and **EffNet AS** show moderate similarity, particularly in mid-to-high frequency bands.
- **EffNet Bio** and **BEATs Bio** consistently underperform compared to their "All" counterparts.
3. **Anomalies**:
- The **TE** row’s negative values (-0.03 to -0.04) are outliers, possibly indicating a different calculation or error.
### Interpretation
The heatmap demonstrates that **EAT All** and **EffNet All** models achieve the highest cosine similarity, particularly in lower frequency bands (0-8 kHz), where values reach 1.00. As frequency increases, similarity generally declines, with **EffNet Bio** and **BEATs Bio** showing the weakest performance. The **TE** row’s negative values suggest a potential anomaly or a distinct metric not aligned with the rest of the data. This could imply that the "TE" category measures a different aspect of similarity or contains errors. The consistent decline in similarity with higher frequency bands highlights the challenges of audio processing in higher frequency ranges across all models.