## Technical Diagram: Architecture Optimization Workflow
### Overview
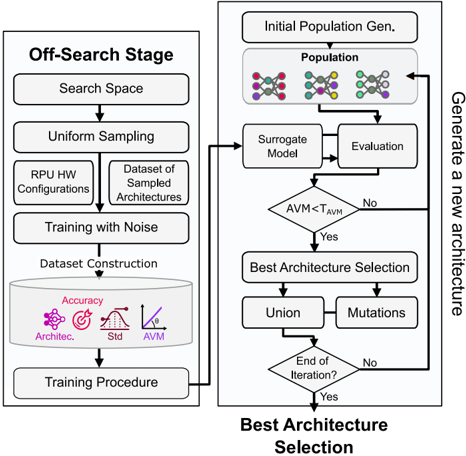
The image displays a two-stage technical flowchart describing an automated architecture search and optimization process. The left stage ("Off-Search Stage") focuses on dataset preparation and preliminary training, while the right stage ("Best Architecture Selection") details an iterative, evolutionary loop for generating and selecting optimal architectures. The diagram uses standard flowchart symbols (rectangles for processes, diamonds for decisions, cylinders for data stores) connected by directional arrows.
### Components/Axes
The diagram is divided into two primary, connected sections:
**1. Left Section: "Off-Search Stage"**
* **Header Label:** "Off-Search Stage" (top-left).
* **Process Flow (Top to Bottom):**
* `Search Space` (Rectangle)
* `Uniform Sampling` (Rectangle)
* Two parallel outputs from sampling:
* `RPU HW Configurations` (Rectangle, left branch)
* `Dataset of Sampled Architectures` (Rectangle, right branch)
* `Training with Noise` (Rectangle, receives both branches)
* `Dataset Construction` (Cylinder/Database symbol). Contains four labeled icons:
* `Accuracy` (Target icon)
* `Architec.` (Network/graph icon)
* `Std` (Bell curve icon)
* `AVM` (Line graph icon)
* `Training Procedure` (Rectangle, final step of this stage).
**2. Right Section: "Best Architecture Selection"**
* **Header Label:** "Best Architecture Selection" (bottom-center).
* **Side Label:** "Generate a new architecture" (vertical text along the right edge).
* **Process Flow (Iterative Loop):**
* `Initial Population Gen.` (Rectangle, entry point).
* `Population` (Rectangle, contains three distinct molecular/graph structure icons).
* `Surrogate Model` (Rectangle).
* `Evaluation` (Rectangle).
* `AVM < T_AVM` (Diamond, decision point). `T_AVM` appears to be a threshold value.
* **"No"** branch loops back to the `Population` box.
* **"Yes"** branch proceeds downward.
* `Best Architecture Selection` (Rectangle).
* Two parallel outputs:
* `Union` (Rectangle, left branch)
* `Mutations` (Rectangle, right branch)
* `End of Iteration?` (Diamond, decision point).
* **"No"** branch loops back to the `Population` box via the "Generate a new architecture" path.
* **"Yes"** branch exits the loop (arrow points down, implying final output).
**Connection:** An arrow connects the `Training Procedure` box (end of left section) to the `Surrogate Model` box (in the right section's loop), indicating data or model flow between the two stages.
### Detailed Analysis
* **Off-Search Stage Flow:** This stage is linear and preparatory. It defines a search space, samples from it to create both hardware configurations and architecture datasets, performs training with noise (likely for robustness), and constructs a final dataset characterized by four metrics: Accuracy, Architecture details, Standard Deviation (Std), and AVM (a performance metric, possibly "Architecture Validation Metric" or similar).
* **Best Architecture Selection Flow:** This is a cyclical, evolutionary algorithm.
1. It starts with an initial population of candidate architectures (represented by molecular icons).
2. Each candidate is processed by a `Surrogate Model` (a faster, approximate model) and then formally `Evaluated`.
3. A decision is made based on whether the candidate's AVM is less than a threshold (`T_AVM`). If not, the candidate is rejected, and the process tries again with the population.
4. If the candidate passes (`AVM < T_AVM`), it undergoes `Best Architecture Selection`.
5. The selected architecture is then used to create new candidates via `Union` (combining traits) and `Mutations` (random alterations).
6. The process checks if the iteration should end. If not, the new set of candidates (from Union and Mutations) feeds back into the `Population` for the next cycle.
### Key Observations
1. **Two-Stage Process:** The workflow clearly separates offline data preparation (left) from online, iterative optimization (right).
2. **Surrogate Model:** The use of a `Surrogate Model` before `Evaluation` suggests the true evaluation is computationally expensive, and a proxy model is used to filter candidates efficiently.
3. **Metric-Driven Decisions:** The core decision gate (`AVM < T_AVM`) is based on a single quantitative metric (AVM), implying this is the primary objective function for optimization.
4. **Evolutionary Mechanisms:** The `Union` and `Mutations` steps are classic genetic algorithm operators, indicating this is an evolutionary or neuroevolutionary search strategy.
5. **Feedback Loops:** There are two "No" feedback loops: one for immediate rejection of poor candidates and one for continuing the iterative search process.
### Interpretation
This diagram outlines a sophisticated automated machine learning (AutoML) or hardware-aware neural architecture search (NAS) pipeline. The **Off-Search Stage** is about building a reliable, characterized dataset that captures the relationship between architectures, hardware configurations (RPU HW), and performance metrics under noisy conditions. This dataset likely trains the `Surrogate Model`.
The **Best Architecture Selection** stage is the core search engine. It uses the surrogate model to rapidly predict the performance (AVM) of candidate architectures. Only candidates that meet a performance threshold (`T_AVM`) are selected to "breed" the next generation through union and mutation. This process iteratively refines the population toward optimal architectures.
The overall goal is to automate the discovery of high-performing, possibly hardware-optimized, computational architectures. The inclusion of "RPU HW Configurations" suggests a focus on specialized processing units (like Reconfigurable Processing Units). The workflow emphasizes efficiency (using a surrogate model) and robustness (training with noise) in the search for optimal designs.