## Bar Charts: Distribution of Counts Across Categories
### Overview
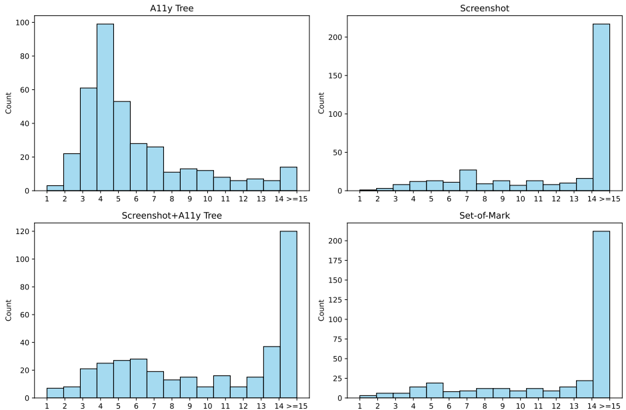
The image contains four grouped bar charts comparing distributions of counts across 15 categories (labeled 1–15, with 14 and 15 combined as "14 >=15"). Each chart uses a consistent blue color scheme, with no explicit legend. The y-axis is uniformly labeled "Count" across all charts, while the x-axis categories vary slightly in distribution patterns.
---
### Components/Axes
- **Y-Axis**: Labeled "Count" (linear scale, 0–200 in increments of 25 for most charts; 0–120 in increments of 20 for "Screenshot+Ally Tree").
- **X-Axis**: Categories labeled 1–15, with "14 >=15" grouping the final two categories.
- **Chart Titles**:
- Top-left: "Ally Tree"
- Top-right: "Screenshot"
- Bottom-left: "Screenshot+Ally Tree"
- Bottom-right: "Set-of-Mark"
---
### Detailed Analysis
#### Ally Tree
- **Trend**: Bimodal distribution with peaks at categories 4 (~100) and 5 (~60), followed by a gradual decline to ~15 at category 14>=15.
- **Key Values**:
- Category 3: ~60
- Category 4: ~100
- Category 5: ~60
- Category 6: ~50
- Category 7: ~30
- Category 8: ~20
- Category 9: ~15
- Category 10: ~10
- Category 11: ~5
- Category 12: ~5
- Category 13: ~5
- Category 14>=15: ~15
#### Screenshot
- **Trend**: Flat distribution with minimal counts (<20) across categories 1–13, followed by a sharp spike at 14>=15 (~200).
- **Key Values**:
- Categories 1–13: ~1–10 (approximate)
- Category 14>=15: ~200
#### Screenshot+Ally Tree
- **Trend**: Moderate distribution with a peak at 14>=15 (~120) and smaller values in earlier categories.
- **Key Values**:
- Category 1: ~5
- Category 2: ~10
- Category 3: ~20
- Category 4: ~25
- Category 5: ~30
- Category 6: ~25
- Category 7: ~20
- Category 8: ~15
- Category 9: ~10
- Category 10: ~5
- Category 11: ~10
- Category 12: ~5
- Category 13: ~5
- Category 14>=15: ~120
#### Set-of-Mark
- **Trend**: Flat distribution with minimal counts (<20) across categories 1–13, followed by a sharp spike at 14>=15 (~200).
- **Key Values**:
- Categories 1–13: ~1–10 (approximate)
- Category 14>=15: ~200
---
### Key Observations
1. **Dominance of 14>=15**: "Screenshot" and "Set-of-Mark" show extreme concentration at the highest category (~200 counts), suggesting a critical threshold or outlier behavior.
2. **Ally Tree's Bimodality**: Peaks at categories 4 and 5 indicate two distinct subgroups within the data.
3. **Combined Effect**: "Screenshot+Ally Tree" merges distributions, retaining the 14>=15 peak (~120) but with broader mid-range values compared to "Ally Tree" alone.
4. **Set-of-Mark's Uniformity**: Minimal variation in early categories contrasts with the extreme spike at 14>=15.
---
### Interpretation
- **Threshold Behavior**: The repeated spike at 14>=15 across "Screenshot" and "Set-of-Mark" implies a systemic boundary or classification rule (e.g., a maximum value, error threshold, or categorical cutoff).
- **Ally Tree's Structure**: The bimodal distribution suggests two competing processes or subgroups within the data, with category 4 being the most prevalent.
- **Combined Insights**: The "Screenshot+Ally Tree" chart reveals that merging datasets amplifies mid-range values but retains the 14>=15 peak, indicating partial overlap in extreme cases.
- **Set-of-Mark's Anomaly**: Its flat distribution with a single outlier peak may represent a specialized or edge-case scenario distinct from the other datasets.
The data collectively highlights the importance of category 14>=15 as a critical focal point, while earlier categories exhibit varying degrees of dispersion or concentration depending on the dataset.