## Line Charts: k-shot Regression Performance
### Overview
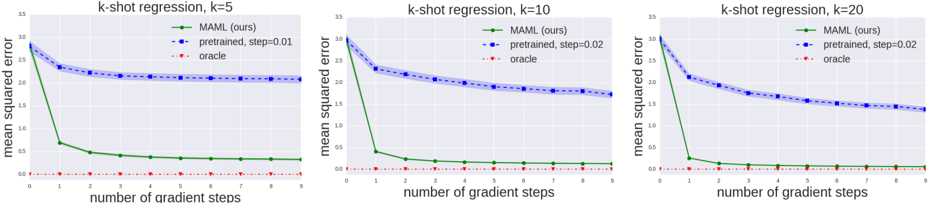
The image presents three line charts comparing the performance of different machine learning approaches (MAML, pre-trained, and oracle) in a k-shot regression task. Each chart corresponds to a different value of 'k' (k=5, k=10, k=20), representing the number of shots. The performance is measured by 'mean squared error' and plotted against the 'number of gradient steps'.
### Components/Axes
Each chart shares the following components:
* **X-axis:** "number of gradient steps", ranging from 0 to approximately 10, with tick marks at integer values.
* **Y-axis:** "mean squared error", ranging from 0 to approximately 1.5 (charts vary slightly).
* **Legend:** Located at the top-right of each chart, containing the following labels and corresponding colors:
* "MAML (ours)" - Green line with triangle markers.
* "pretrained, step=0.02" - Blue dashed line with circle markers.
* "oracle" - Red dotted line with plus markers.
* **Title:** Each chart has a title indicating the k-shot regression scenario (e.g., "k-shot regression, k=5").
### Detailed Analysis or Content Details
**Chart 1: k=5**
* **MAML (Green):** The line starts at approximately 1.2 mean squared error at 0 gradient steps and rapidly decreases to approximately 0.15 at 1 gradient step. It then plateaus, fluctuating around 0.15 to 0.2 for the remaining gradient steps.
* **Pretrained (Blue):** The line begins at approximately 1.3 mean squared error at 0 gradient steps and decreases steadily to approximately 0.35 at 10 gradient steps. The decrease is more gradual than MAML.
* **Oracle (Red):** The line is nearly flat, consistently around 0.02 mean squared error across all gradient steps.
**Chart 2: k=10**
* **MAML (Green):** Starts at approximately 1.1 mean squared error at 0 gradient steps and drops sharply to approximately 0.1 at 1 gradient step. It then plateaus, remaining around 0.1 to 0.15 for the rest of the gradient steps.
* **Pretrained (Blue):** Starts at approximately 1.0 mean squared error at 0 gradient steps and decreases steadily to approximately 0.3 at 10 gradient steps.
* **Oracle (Red):** Remains consistently around 0.02 mean squared error.
**Chart 3: k=20**
* **MAML (Green):** Starts at approximately 0.9 mean squared error at 0 gradient steps and quickly decreases to approximately 0.1 at 1 gradient step. It then plateaus, fluctuating between 0.1 and 0.15 for the remaining gradient steps.
* **Pretrained (Blue):** Starts at approximately 0.8 mean squared error at 0 gradient steps and decreases steadily to approximately 0.25 at 10 gradient steps.
* **Oracle (Red):** Remains consistently around 0.02 mean squared error.
### Key Observations
* MAML consistently outperforms the pre-trained model across all values of 'k' and number of gradient steps.
* The oracle method achieves the lowest mean squared error, serving as an upper bound on performance.
* The performance of the pre-trained model improves with an increasing number of gradient steps, but it does not reach the performance level of MAML.
* As 'k' increases (from 5 to 20), the initial mean squared error for both MAML and the pre-trained model decreases, indicating improved performance with more shots.
* The rate of improvement for MAML diminishes quickly after the first gradient step, suggesting rapid adaptation.
### Interpretation
The data demonstrates the effectiveness of the MAML algorithm for k-shot regression. MAML achieves significantly lower mean squared error compared to the pre-trained model, especially in the early stages of gradient descent. This suggests that MAML is better at quickly adapting to new tasks with limited data. The oracle method represents the optimal performance achievable, and the gap between MAML and the oracle indicates potential areas for further improvement. The decreasing initial error with increasing 'k' confirms the expected behavior that more data (shots) generally leads to better performance. The consistent performance of the oracle method highlights its role as a theoretical upper bound. The pre-trained model's gradual improvement suggests that it benefits from continued training, but it may require more gradient steps to reach comparable performance to MAML.