## k-shot Regression Performance Comparison: MAML vs. Pretrained vs. Oracle
### Overview
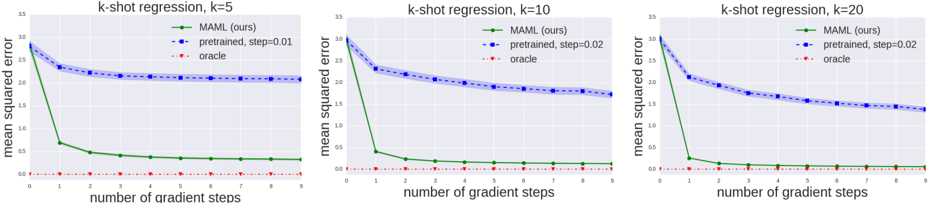
The image displays three line charts arranged horizontally, comparing the performance of three different methods on k-shot regression tasks for k=5, k=10, and k=20. The charts plot the mean squared error (MSE) against the number of gradient steps taken during adaptation. The primary comparison is between a method labeled "MAML (ours)" and a "pretrained" baseline, with an "oracle" representing a theoretical lower bound.
### Components/Axes
* **Chart Titles (Top Center):**
* Left Chart: `k-shot regression, k=5`
* Middle Chart: `k-shot regression, k=10`
* Right Chart: `k-shot regression, k=20`
* **Y-Axis (Vertical, Left Side of Each Chart):**
* Label: `mean squared error`
* Scale: Linear, ranging from `0.0` to `3.0` with major ticks at 0.5 intervals (0.0, 0.5, 1.0, 1.5, 2.0, 2.5, 3.0).
* **X-Axis (Horizontal, Bottom of Each Chart):**
* Label: `number of gradient steps`
* Scale: Linear, discrete integer values from `0` to `9`.
* **Legend (Top-Right Corner of Each Chart):**
* A green solid line with circle markers: `MAML (ours)`
* A blue dashed line with square markers: `pretrained, step=0.01` (for k=5) or `pretrained, step=0.02` (for k=10 and k=20).
* A red dotted line with diamond markers: `oracle`
### Detailed Analysis
**Chart 1: k-shot regression, k=5**
* **MAML (ours) - Green Line:** Starts at an MSE of approximately `2.8` at step 0. Shows a very steep decline to ~`0.7` at step 1, then a gradual decrease, plateauing at approximately `0.3` from step 4 onwards.
* **Pretrained, step=0.01 - Blue Line:** Starts at the same point as MAML (~`2.8`). Decreases steadily but much more slowly, reaching an MSE of approximately `2.1` by step 9. The slope is consistently negative but shallow.
* **Oracle - Red Line:** Remains nearly flat at an MSE very close to `0.0` (approximately `0.05`) across all gradient steps.
**Chart 2: k-shot regression, k=10**
* **MAML (ours) - Green Line:** Starts at an MSE of approximately `2.9` at step 0. Drops sharply to ~`0.4` at step 1, then continues a slower decline, stabilizing at approximately `0.15` from step 5 onwards.
* **Pretrained, step=0.02 - Blue Line:** Starts at ~`2.9`. Decreases at a moderate, steady rate, ending at an MSE of approximately `1.7` at step 9. The final error is lower than in the k=5 case.
* **Oracle - Red Line:** Consistently near `0.0` MSE, similar to the k=5 chart.
**Chart 3: k-shot regression, k=20**
* **MAML (ours) - Green Line:** Starts at an MSE of approximately `2.9` at step 0. Plummets to ~`0.25` at step 1, then further declines to a plateau of approximately `0.1` from step 4 onwards.
* **Pretrained, step=0.02 - Blue Line:** Starts at ~`2.9`. Shows a steady decline, reaching its lowest point among the three charts at an MSE of approximately `1.4` by step 9.
* **Oracle - Red Line:** Again, remains flat near `0.0` MSE.
### Key Observations
1. **Consistent Superiority of MAML:** In all three scenarios (k=5, 10, 20), the MAML method achieves a dramatically lower final mean squared error than the pretrained baseline after just 1-2 gradient steps.
2. **Impact of k (Shot Count):** As `k` increases from 5 to 20, the final performance of both MAML and the pretrained model improves (lower MSE). MAML's final error drops from ~0.3 (k=5) to ~0.1 (k=20). The pretrained model's final error drops from ~2.1 (k=5) to ~1.4 (k=20).
3. **Adaptation Speed:** MAML exhibits extremely fast adaptation, with the most significant performance gain occurring within the first gradient step. The pretrained model adapts much more gradually.
4. **Oracle Baseline:** The oracle performance is consistently near-zero error, serving as a reference for the best possible outcome given the task structure.
5. **Pretrained Step Size:** The step size for the pretrained model is noted as 0.01 for k=5 and 0.02 for k=10 and k=20, suggesting a hyperparameter adjustment was made for the higher-shot regimes.
### Interpretation
This figure demonstrates the core advantage of the Model-Agnostic Meta-Learning (MAML) algorithm in few-shot learning scenarios. The data suggests that MAML learns an initialization that is highly optimized for rapid adaptation. The sharp initial drop in its error curve indicates that with just one or two updates, it can specialize effectively to a new task from very few examples (k=5, 10, or 20).
In contrast, the pretrained model, while showing some capacity to adapt (its error does decrease), starts from a much less optimal point for these specific regression tasks and improves at a slower, more linear rate. The gap between the green (MAML) and blue (pretrained) lines visually quantifies the "meta-learning" advantage.
The improvement in final performance for both methods as `k` increases is expected, as more data points (shots) provide a stronger signal for adaptation. However, MAML's ability to reach a near-oracle performance level with only 20 examples (k=20) highlights its data efficiency. The charts collectively argue that meta-learning provides a superior inductive bias for few-shot regression compared to standard pretraining followed by fine-tuning.