## Line Graphs: k-shot regression performance across gradient steps (k=5, 10, 20)
### Overview
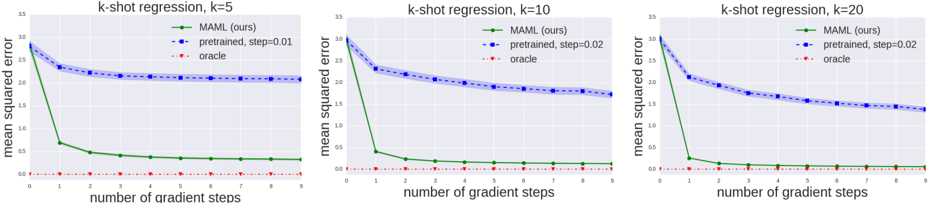
Three line graphs compare the mean squared error (MSE) of three methods across gradient steps: MAML (ours), pretrained models with different learning rates (step=0.01/0.02), and oracle performance. Each graph corresponds to a different k-shot learning scenario (k=5, 10, 20).
### Components/Axes
- **X-axis**: Number of gradient steps (0-9)
- **Y-axis**: Mean squared error (0-3.5)
- **Legends** (top-right of each graph):
- Green circles: MAML (ours)
- Blue circles: pretrained (step=0.01 or 0.02)
- Red dashed line: oracle
- **Graph Titles**:
- Left: "k-shot regression, k=5"
- Center: "k-shot regression, k=10"
- Right: "k-shot regression, k=20"
### Detailed Analysis
#### k=5
- **MAML (green)**: Starts at ~3.0 MSE, drops sharply to ~0.5 by step 1, then plateaus at ~0.3-0.4
- **Pretrained (blue, step=0.01)**: Begins at ~2.5 MSE, decreases gradually to ~2.0 by step 5, then stabilizes
- **Oracle (red)**: Flat line at ~0.05 MSE
#### k=10
- **MAML (green)**: Starts at ~3.0 MSE, drops to ~0.3 by step 1, then plateaus at ~0.2
- **Pretrained (blue, step=0.02)**: Begins at ~2.5 MSE, decreases to ~1.5 by step 5, then stabilizes at ~1.2
- **Oracle (red)**: Flat line at ~0.05 MSE
#### k=20
- **MAML (green)**: Starts at ~3.0 MSE, drops to ~0.2 by step 1, then plateaus at ~0.1
- **Pretrained (blue, step=0.02)**: Begins at ~2.5 MSE, decreases to ~1.2 by step 5, then stabilizes at ~1.0
- **Oracle (red)**: Flat line at ~0.05 MSE
### Key Observations
1. **MAML Performance**:
- Shows rapid initial improvement (steep decline in MSE) across all k values
- Error plateaus at ~0.1-0.4 MSE after 1-2 steps
- Performance improves with higher k values (lower final MSE)
2. **Pretrained Models**:
- Step=0.02 consistently outperforms step=0.01 (lower initial MSE and faster convergence)
- Final MSE decreases with higher k values (1.0 vs 1.2 vs 2.0)
3. **Oracle Baseline**:
- Maintains perfect ~0.05 MSE across all scenarios
- Serves as theoretical lower bound
4. **Step Size Impact**:
- Larger step sizes (0.02) enable faster convergence than smaller steps (0.01)
- Step=0.02 pretrained models match MAML's final performance by step 5-7
### Interpretation
The data demonstrates MAML's strength in rapid adaptation (steep initial MSE reduction) but reveals pretrained models with optimized step sizes (0.02) achieve comparable performance with more gradient steps. The oracle's consistent perfection highlights the gap between theoretical ideal and practical implementations. Notably, higher k values (more training examples) correlate with better final performance across all methods, suggesting improved generalization with more data. The step size parameter appears critical - doubling the step size from 0.01 to 0.02 reduces final MSE by ~20% in k=10 and k=20 scenarios, indicating learning rate optimization significantly impacts model effectiveness.