## Flowchart: Research Paper Structure
### Overview
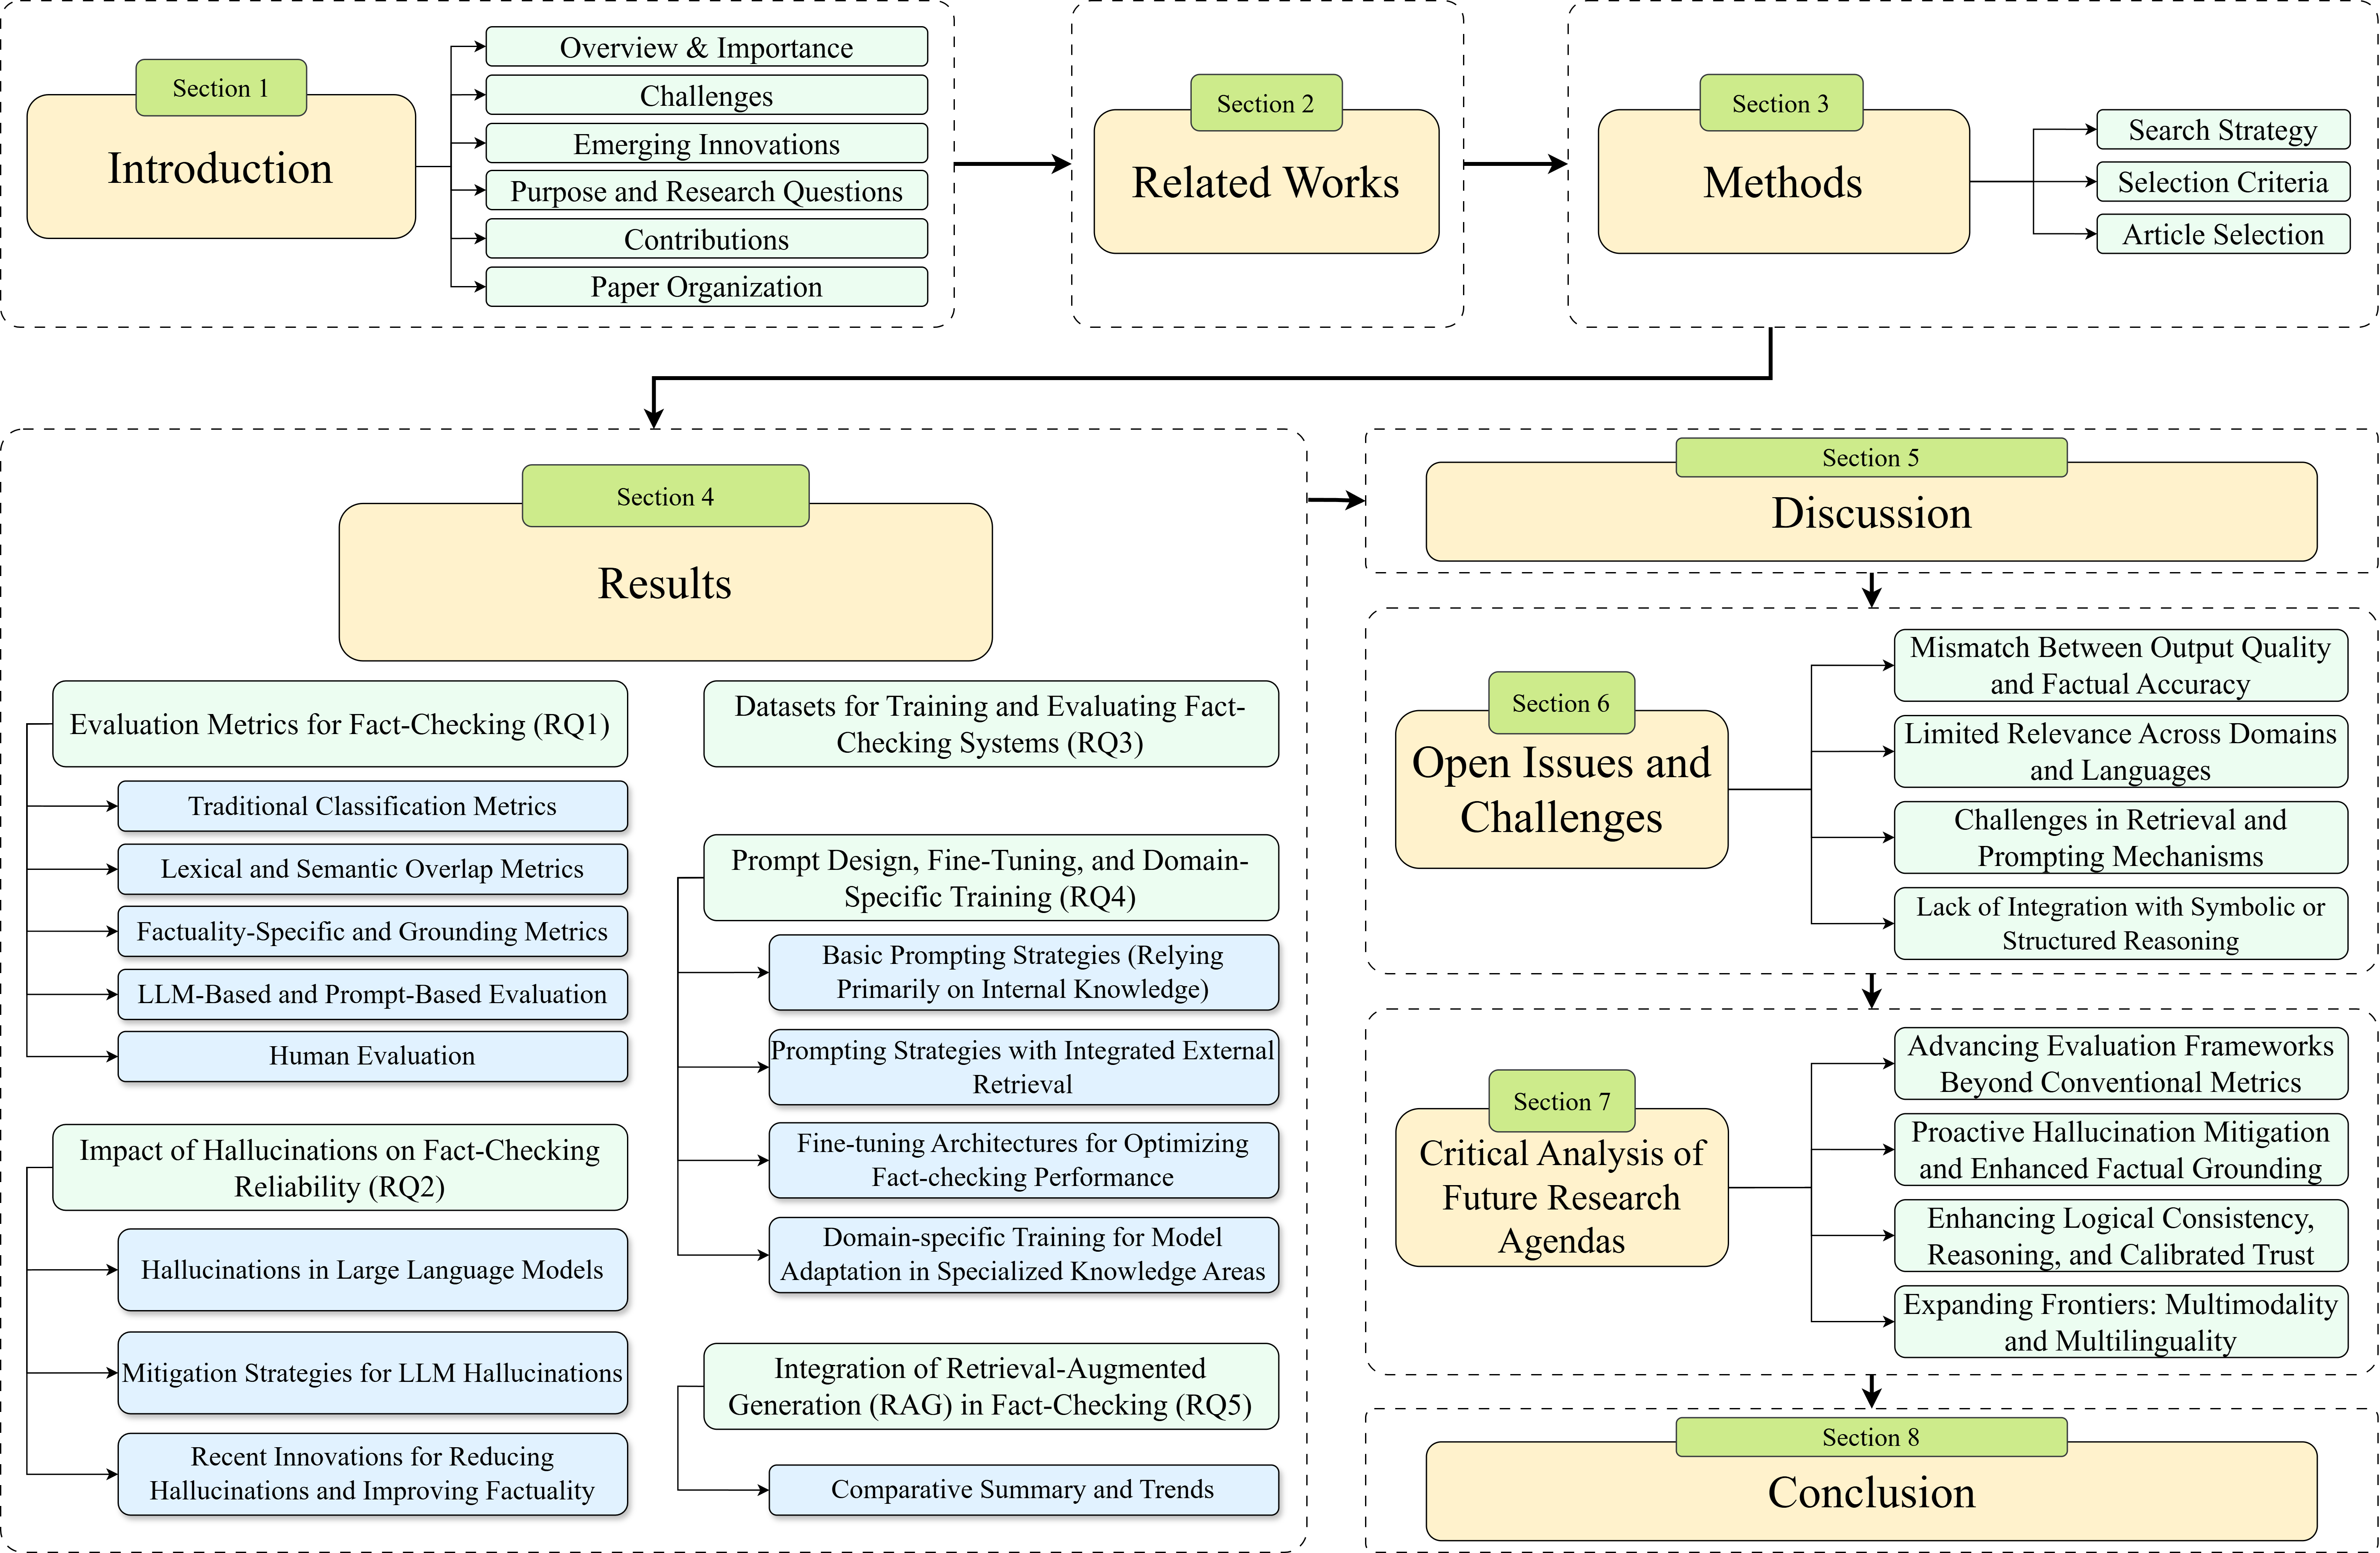
The image is a flowchart outlining the structure of a research paper, specifically focusing on fact-checking. It details the sections, their content, and the flow of information between them.
### Components/Axes
The flowchart consists of rectangular boxes representing different sections of the paper. Arrows indicate the flow of information between sections. The boxes are colored in light yellow with green labels indicating the section number.
**Sections:**
* Section 1: Introduction
* Overview & Importance
* Challenges
* Emerging Innovations
* Purpose and Research Questions
* Contributions
* Paper Organization
* Section 2: Related Works
* Section 3: Methods
* Search Strategy
* Selection Criteria
* Article Selection
* Section 4: Results
* Evaluation Metrics for Fact-Checking (RQ1)
* Traditional Classification Metrics
* Lexical and Semantic Overlap Metrics
* Factuality-Specific and Grounding Metrics
* LLM-Based and Prompt-Based Evaluation
* Human Evaluation
* Impact of Hallucinations on Fact-Checking Reliability (RQ2)
* Hallucinations in Large Language Models
* Mitigation Strategies for LLM Hallucinations
* Recent Innovations for Reducing Hallucinations and Improving Factuality
* Datasets for Training and Evaluating Fact-Checking Systems (RQ3)
* Prompt Design, Fine-Tuning, and Domain-Specific Training (RQ4)
* Basic Prompting Strategies (Relying Primarily on Internal Knowledge)
* Prompting Strategies with Integrated External Retrieval
* Fine-tuning Architectures for Optimizing Fact-checking Performance
* Domain-specific Training for Model Adaptation in Specialized Knowledge Areas
* Integration of Retrieval-Augmented Generation (RAG) in Fact-Checking (RQ5)
* Comparative Summary and Trends
* Section 5: Discussion
* Section 6: Open Issues and Challenges
* Mismatch Between Output Quality and Factual Accuracy
* Limited Relevance Across Domains and Languages
* Challenges in Retrieval and Prompting Mechanisms
* Lack of Integration with Symbolic or Structured Reasoning
* Section 7: Critical Analysis of Future Research Agendas
* Advancing Evaluation Frameworks Beyond Conventional Metrics
* Proactive Hallucination Mitigation and Enhanced Factual Grounding
* Enhancing Logical Consistency, Reasoning, and Calibrated Trust
* Expanding Frontiers: Multimodality and Multilinguality
* Section 8: Conclusion
### Detailed Analysis or ### Content Details
The flowchart starts with the "Introduction" (Section 1), which covers the overview, importance, challenges, emerging innovations, purpose, contributions, and paper organization. It then proceeds to "Related Works" (Section 2) and "Methods" (Section 3), which includes search strategy, selection criteria, and article selection. The "Results" section (Section 4) is divided into several sub-sections based on research questions (RQ1-RQ5), covering evaluation metrics, impact of hallucinations, datasets, prompt design, and integration of RAG. The flowchart then moves to "Discussion" (Section 5), "Open Issues and Challenges" (Section 6), and "Critical Analysis of Future Research Agendas" (Section 7), before concluding with "Conclusion" (Section 8).
### Key Observations
* The flowchart provides a structured overview of a research paper focused on fact-checking.
* The "Results" section is the most detailed, with multiple sub-sections addressing specific research questions.
* The flow of information is generally linear, moving from introduction to conclusion.
### Interpretation
The flowchart illustrates a systematic approach to structuring a research paper on fact-checking. It highlights the key components and their relationships, providing a roadmap for researchers in this field. The emphasis on hallucinations and RAG indicates the current focus and challenges in fact-checking research. The inclusion of future research agendas suggests a forward-looking perspective, aiming to address the limitations and expand the scope of fact-checking methodologies.