## Bar Charts: Problem Solving Capability vs. Human Thinking Time
### Overview
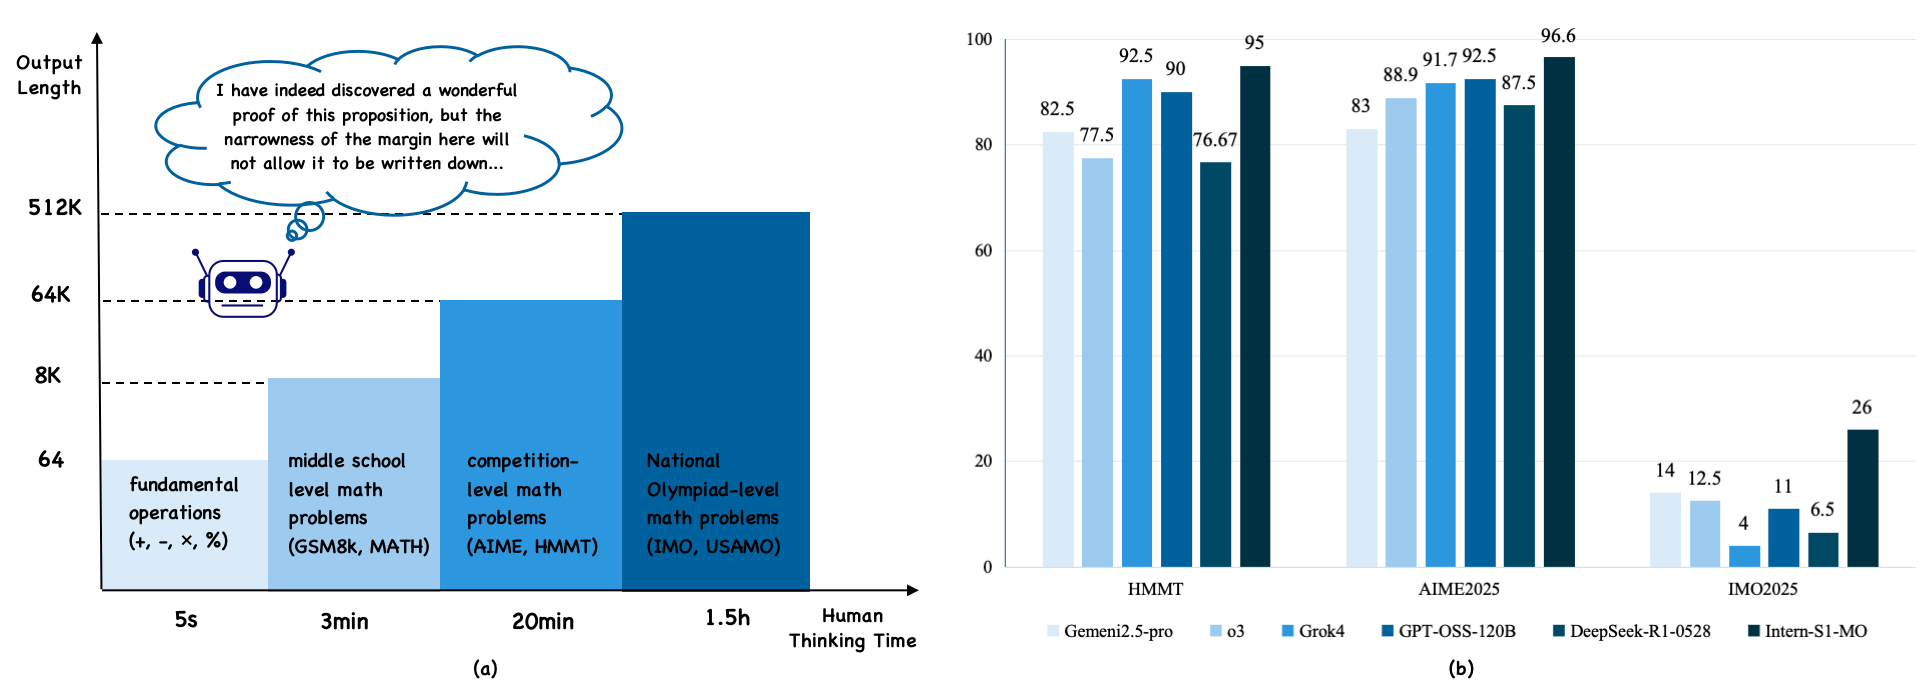
The image presents two bar charts comparing the problem-solving capabilities of AI models against human thinking time for different levels of math problems. Chart (a) illustrates the relationship between the complexity of math problems and the human thinking time required, while chart (b) compares the performance of various AI models on specific math competitions.
### Components/Axes
**Chart (a): Human Thinking Time vs. Output Length**
* **Y-axis (Output Length):** Represents the output length, with markers at 64, 8K, 64K, and 512K.
* **X-axis (Human Thinking Time):** Represents the time required for humans to solve different types of math problems, with categories:
* Fundamental operations (+, -, ×, %): 5 seconds
* Middle school level math problems (GSM8K, MATH): 3 minutes
* Competition-level math problems (AIME, HMMT): 20 minutes
* National Olympiad-level math problems (IMO, USAMO): 1.5 hours
* **Additional Elements:**
* A cartoon robot is present near the 64K mark on the Y-axis.
* A thought bubble above the robot contains the text: "I have indeed discovered a wonderful proof of this proposition, but the narrowness of the margin here will not allow it to be written down..."
**Chart (b): AI Model Performance on Math Competitions**
* **Y-axis:** Numerical scale from 0 to 100, incrementing by 20.
* **X-axis:** Represents different math competitions:
* HMMT
* AIME2025
* IMO2025
* **Legend (located at the bottom):**
* Gemeni2.5-pro (lightest blue)
* o3 (light blue)
* Grok4 (medium blue)
* GPT-OSS-120B (dark blue)
* DeepSeek-R1-0528 (darkest blue)
* Intern-S1-MO (black)
### Detailed Analysis
**Chart (a): Human Thinking Time vs. Output Length**
* The chart shows a positive correlation between the complexity of math problems and the human thinking time required. As the level of math problems increases from fundamental operations to National Olympiad-level, the required human thinking time increases from seconds to hours.
* The bar heights are not precisely quantified, but they visually represent an increasing output length as problem complexity increases.
* Fundamental operations: ~64
* Middle school level math problems: ~8K
* Competition-level math problems: ~64K
* National Olympiad-level math problems: ~512K
**Chart (b): AI Model Performance on Math Competitions**
* The chart compares the performance of different AI models on three math competitions: HMMT, AIME2025, and IMO2025.
* The Y-axis represents the score or performance metric, ranging from 0 to 100.
**Data Points:**
* **HMMT:**
* Gemeni2.5-pro: 82.5
* o3: 77.5
* Grok4: 92.5
* GPT-OSS-120B: 90
* DeepSeek-R1-0528: 76.67
* Intern-S1-MO: 95
* **AIME2025:**
* Gemeni2.5-pro: 83
* o3: 88.9
* Grok4: 91.7
* GPT-OSS-120B: 92.5
* DeepSeek-R1-0528: 87.5
* Intern-S1-MO: 96.6
* **IMO2025:**
* Gemeni2.5-pro: 14
* o3: 12.5
* Grok4: 4
* GPT-OSS-120B: 11
* DeepSeek-R1-0528: 6.5
* Intern-S1-MO: 26
### Key Observations
* In chart (a), the human thinking time increases significantly with the complexity of the math problems.
* In chart (b), the AI models generally perform well on HMMT and AIME2025, with scores ranging from approximately 75 to 97. However, their performance drops significantly on IMO2025, with scores ranging from approximately 4 to 26.
* The Intern-S1-MO model consistently achieves the highest scores across all three math competitions.
* The Grok4 model shows a relatively lower performance on IMO2025 compared to other models.
### Interpretation
The data suggests that AI models are capable of solving complex math problems, but their performance varies depending on the type and difficulty of the problem. The models perform well on competition-level problems (AIME, HMMT) but struggle with National Olympiad-level problems (IMO, USAMO). This indicates that AI models may require further development to handle the complexity and nuances of the most challenging math problems. The Intern-S1-MO model appears to be the most proficient among the tested models, while the Grok4 model may have limitations in solving highly complex problems. The thought bubble in chart (a) humorously suggests that while AI can solve these problems, the explanation might be too complex to fit within a limited space.