## Line Graphs: Loss vs Training Steps for MHA2MLA and GQA2MLA Models
### Overview
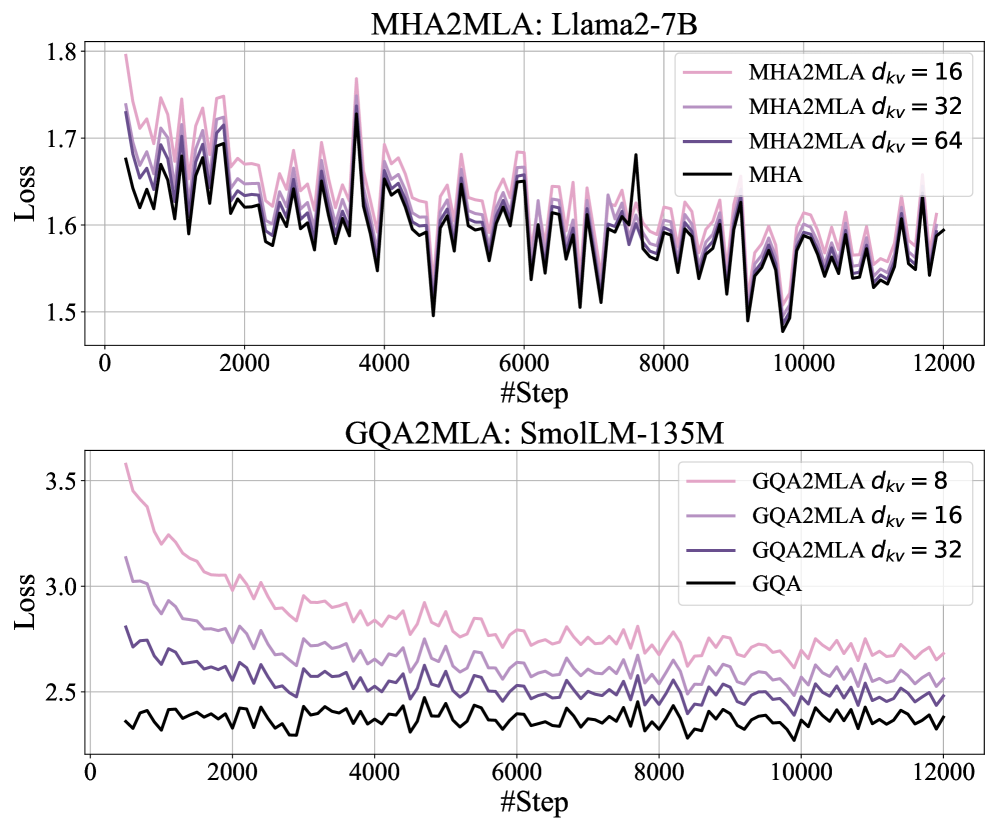
The image contains two line graphs comparing loss values across training steps for different model architectures. The top graph shows results for the MHA2MLA architecture on Llama2-7B, while the bottom graph displays results for GQA2MLA on SmolLM-135M. Each graph compares multiple configurations with varying `d_kv` values against baseline models (MHA and GQA respectively).
### Components/Axes
**Top Graph (MHA2MLA: Llama2-7B):**
- **X-axis**: "#Step" (0 to 12,000)
- **Y-axis**: "Loss" (1.5 to 1.8)
- **Legend**:
- Pink: MHA2MLA `d_kv` = 16
- Purple: MHA2MLA `d_kv` = 32
- Dark Purple: MHA2MLA `d_kv` = 64
- Black: MHA (baseline)
**Bottom Graph (GQA2MLA: SmolLM-135M):**
- **X-axis**: "#Step" (0 to 12,000)
- **Y-axis**: "Loss" (2.5 to 3.5)
- **Legend**:
- Pink: GQA2MLA `d_kv` = 8
- Purple: GQA2MLA `d_kv` = 16
- Dark Purple: GQA2MLA `d_kv` = 32
- Black: GQA (baseline)
### Detailed Analysis
**Top Graph Trends:**
1. All lines exhibit high-frequency oscillations with sharp peaks/troughs.
2. MHA2MLA variants (`d_kv` = 16, 32, 64) consistently show slightly higher loss than MHA baseline.
3. Loss values cluster between 1.6-1.75, with no clear convergence trend.
4. Larger `d_kv` values (64) show marginally higher peaks than smaller values.
**Bottom Graph Trends:**
1. All lines show a general downward trend over steps.
2. GQA2MLA variants (`d_kv` = 8, 16, 32) start with higher loss than GQA baseline but converge toward similar values.
3. Loss decreases from ~3.5 to ~2.6 over 12,000 steps.
4. Larger `d_kv` values (32) begin with higher loss but show similar convergence behavior to smaller values.
### Key Observations
1. **MHA2MLA vs MHA**: All MHA2MLA configurations maintain ~5-10% higher loss than MHA baseline throughout training.
2. **GQA2MLA vs GQA**: GQA2MLA variants demonstrate improvement over baseline GQA, with loss decreasing by ~25% over training.
3. **`d_kv` Impact**: Larger `d_kv` values (64 in MHA2MLA, 32 in GQA2MLA) show marginally higher initial loss but similar convergence patterns to smaller values.
4. **Volatility**: Both graphs exhibit high-frequency noise, suggesting unstable training dynamics.
### Interpretation
The graphs reveal architectural tradeoffs in transformer-based models:
1. **MHA2MLA**: While potentially offering architectural improvements, the increased loss suggests suboptimal parameter initialization or training instability compared to standard MHA.
2. **GQA2MLA**: Demonstrates clear performance gains over baseline GQA, with larger `d_kv` values showing faster initial improvement despite higher starting loss.
3. **`d_kv` Scaling**: Larger `d_kv` values (key dimension) appear to require more training steps to stabilize, though they ultimately converge to similar loss values as smaller configurations.
4. **Training Dynamics**: The high-frequency oscillations in both graphs indicate potential challenges with gradient stability or optimization landscape complexity in these architectures.
The data suggests that while MHA2MLA may not outperform standard MHA in this configuration, GQA2MLA shows promising improvements. The `d_kv` parameter's impact appears more pronounced in the GQA2MLA architecture, where larger values enable better initial performance despite higher computational costs.