\n
## Line Chart: Answer Accuracy vs. Layer for Mistral Models
### Overview
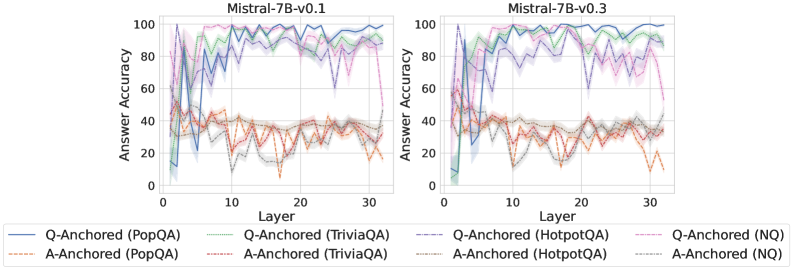
This image presents two line charts, side-by-side, comparing the answer accuracy of the Mistral-7B-v0.1 and Mistral-7B-v0.3 models across different layers. The x-axis represents the layer number (from 0 to 30), and the y-axis represents the answer accuracy (from 0 to 100). Each chart displays multiple lines, each representing a different question-answering dataset and anchoring method.
### Components/Axes
* **X-axis:** Layer (0 to 30, with tick marks at intervals of 5)
* **Y-axis:** Answer Accuracy (0 to 100, with tick marks at intervals of 20)
* **Left Chart Title:** Mistral-7B-v0.1
* **Right Chart Title:** Mistral-7B-v0.3
* **Legend (Bottom):**
* Blue Line: Q-Anchored (PopQA)
* Orange Line: A-Anchored (PopQA)
* Green Line: Q-Anchored (TriviaQA)
* Purple Line: A-Anchored (TriviaQA)
* Gray Dashed Line: Q-Anchored (HotpotQA)
* Red Dashed Line: A-Anchored (HotpotQA)
* Light Blue Line: Q-Anchored (NQ)
* Brown Line: A-Anchored (NQ)
### Detailed Analysis or Content Details
**Mistral-7B-v0.1 (Left Chart):**
* **Q-Anchored (PopQA) - Blue Line:** Starts at approximately 80, dips to around 20 at layer 2, fluctuates between 60-90 for layers 3-25, then decreases to around 60 at layer 30.
* **A-Anchored (PopQA) - Orange Line:** Starts at approximately 40, remains relatively stable between 30-50 for layers 0-25, then decreases to around 30 at layer 30.
* **Q-Anchored (TriviaQA) - Green Line:** Starts at approximately 90, dips to around 50 at layer 2, fluctuates between 60-90 for layers 3-25, then decreases to around 60 at layer 30.
* **A-Anchored (TriviaQA) - Purple Line:** Starts at approximately 70, dips to around 30 at layer 2, fluctuates between 40-70 for layers 3-25, then decreases to around 40 at layer 30.
* **Q-Anchored (HotpotQA) - Gray Dashed Line:** Starts at approximately 90, dips to around 40 at layer 2, fluctuates between 60-90 for layers 3-25, then decreases to around 60 at layer 30.
* **A-Anchored (HotpotQA) - Red Dashed Line:** Starts at approximately 50, dips to around 20 at layer 2, fluctuates between 30-50 for layers 3-25, then decreases to around 30 at layer 30.
* **Q-Anchored (NQ) - Light Blue Line:** Starts at approximately 90, dips to around 40 at layer 2, fluctuates between 60-90 for layers 3-25, then decreases to around 60 at layer 30.
* **A-Anchored (NQ) - Brown Line:** Starts at approximately 40, dips to around 20 at layer 2, fluctuates between 30-50 for layers 3-25, then decreases to around 30 at layer 30.
**Mistral-7B-v0.3 (Right Chart):**
* **Q-Anchored (PopQA) - Blue Line:** Starts at approximately 90, dips to around 30 at layer 2, fluctuates between 60-90 for layers 3-25, then decreases to around 60 at layer 30.
* **A-Anchored (PopQA) - Orange Line:** Starts at approximately 40, remains relatively stable between 30-50 for layers 0-25, then decreases to around 30 at layer 30.
* **Q-Anchored (TriviaQA) - Green Line:** Starts at approximately 90, dips to around 50 at layer 2, fluctuates between 60-90 for layers 3-25, then decreases to around 60 at layer 30.
* **A-Anchored (TriviaQA) - Purple Line:** Starts at approximately 70, dips to around 30 at layer 2, fluctuates between 40-70 for layers 3-25, then decreases to around 40 at layer 30.
* **Q-Anchored (HotpotQA) - Gray Dashed Line:** Starts at approximately 90, dips to around 40 at layer 2, fluctuates between 60-90 for layers 3-25, then decreases to around 60 at layer 30.
* **A-Anchored (HotpotQA) - Red Dashed Line:** Starts at approximately 50, dips to around 20 at layer 2, fluctuates between 30-50 for layers 3-25, then decreases to around 30 at layer 30.
* **Q-Anchored (NQ) - Light Blue Line:** Starts at approximately 90, dips to around 40 at layer 2, fluctuates between 60-90 for layers 3-25, then decreases to around 60 at layer 30.
* **A-Anchored (NQ) - Brown Line:** Starts at approximately 40, dips to around 20 at layer 2, fluctuates between 30-50 for layers 3-25, then decreases to around 30 at layer 30.
### Key Observations
* Both models exhibit a significant dip in accuracy around layer 2 across all datasets and anchoring methods.
* Q-Anchored methods consistently outperform A-Anchored methods across all datasets for both models.
* The accuracy generally fluctuates between 60-90% for Q-Anchored methods after the initial dip.
* A-Anchored methods generally have lower accuracy, fluctuating between 30-50%.
* Mistral-7B-v0.3 generally shows higher initial accuracy than Mistral-7B-v0.1.
### Interpretation
The charts demonstrate the impact of model layers on answer accuracy for different question-answering datasets. The initial dip in accuracy at layer 2 suggests a potential issue with the model's initial processing of information. The consistent outperformance of Q-Anchored methods indicates that anchoring the question is more effective than anchoring the answer for these tasks. The higher accuracy of Mistral-7B-v0.3 suggests that the updates made in this version have improved the model's performance. The fluctuations in accuracy across layers could be due to the complexity of the datasets and the model's ability to generalize to different types of questions. The relatively stable performance of A-Anchored methods suggests they are less sensitive to layer variations, but also less capable of achieving high accuracy. The data suggests that further investigation into the layer 2 dip and the effectiveness of different anchoring methods could lead to further improvements in model performance.