TECHNICAL ASSET FINGERPRINT
0ea3d8492ea1939b83b9f317
Click to view fullscreen
Press ESC or click to close
FOUND IN PAPERS
EXPERT: healer-alpha-free VERSION 1
RUNTIME: free/openrouter/healer-alpha
INTEL_VERIFIED
\n
## Line Charts: Answer Accuracy by Layer for Mistral-7B Model Versions
### Overview
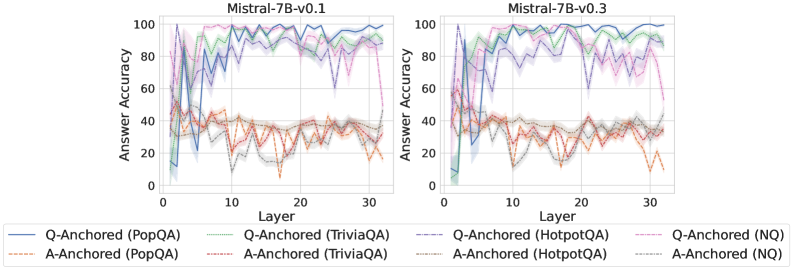
The image displays two side-by-side line charts comparing the "Answer Accuracy" of two model versions (Mistral-7B-v0.1 and Mistral-7B-v0.3) across 30+ layers. Each chart plots the performance of eight different evaluation setups, defined by a method (Q-Anchored or A-Anchored) and a dataset (PopQA, TriviaQA, HotpotQA, NQ). The charts are designed to show how internal model layer progression affects accuracy on different knowledge-intensive question-answering tasks.
### Components/Axes
* **Chart Titles:**
* Left Chart: `Mistral-7B-v0.1`
* Right Chart: `Mistral-7B-v0.3`
* **Y-Axis (Both Charts):** Label: `Answer Accuracy`. Scale: 0 to 100, with major tick marks at 0, 20, 40, 60, 80, 100.
* **X-Axis (Both Charts):** Label: `Layer`. Scale: 0 to 30, with major tick marks at 0, 10, 20, 30.
* **Legend (Bottom, spanning both charts):** Contains 8 entries, each with a colored line sample and a label. The legend is positioned below the x-axis labels.
1. **Solid Blue Line:** `Q-Anchored (PopQA)`
2. **Dashed Orange Line:** `A-Anchored (PopQA)`
3. **Solid Green Line:** `Q-Anchored (TriviaQA)`
4. **Dashed Red Line:** `A-Anchored (TriviaQA)`
5. **Solid Purple Line:** `Q-Anchored (HotpotQA)`
6. **Dashed Brown Line:** `A-Anchored (HotpotQA)`
7. **Solid Pink Line:** `Q-Anchored (NQ)`
8. **Dashed Gray Line:** `A-Anchored (NQ)`
### Detailed Analysis
**Chart 1: Mistral-7B-v0.1 (Left)**
* **Q-Anchored Series (Solid Lines):** All four series show a similar pattern: very low accuracy (<20%) at layer 0, a sharp spike to high accuracy (60-90% range) by layer ~5, followed by high but volatile performance across the remaining layers, generally staying between 60% and 100%.
* `Q-Anchored (PopQA)` (Blue): Peaks near 100% around layer 5, then fluctuates heavily between ~70% and 100%.
* `Q-Anchored (TriviaQA)` (Green): Follows a similar volatile high-accuracy path, often intertwining with the blue line.
* `Q-Anchored (HotpotQA)` (Purple): Also volatile, with a notable dip to ~60% around layer 25.
* `Q-Anchored (NQ)` (Pink): Shows the most volatility among the Q-Anchored lines, with several deep dips (e.g., to ~60% near layer 28).
* **A-Anchored Series (Dashed Lines):** All four series exhibit significantly lower and more volatile accuracy compared to their Q-Anchored counterparts. They fluctuate primarily in the 10% to 50% range.
* `A-Anchored (PopQA)` (Orange): Highly erratic, with values bouncing between ~10% and 50%.
* `A-Anchored (TriviaQA)` (Red): Similar volatility, often in the 20-40% range.
* `A-Anchored (HotpotQA)` (Brown): Shows a slight upward trend from layer 0 to 30 but remains below 50%.
* `A-Anchored (NQ)` (Gray): Also highly volatile, with a notable low point near 10% around layer 10.
**Chart 2: Mistral-7B-v0.3 (Right)**
* **Q-Anchored Series (Solid Lines):** The pattern is similar to v0.1 but appears slightly more stable at the high end for some datasets.
* `Q-Anchored (PopQA)` (Blue): Still volatile but seems to spend more time in the 80-100% band after layer 10.
* `Q-Anchored (TriviaQA)` (Green): Very high and relatively stable performance, frequently touching or exceeding 90% after layer 10.
* `Q-Anchored (HotpotQA)` (Purple): Shows a strong upward trend from layer 0, becoming one of the top performers after layer 15, often above 80%.
* `Q-Anchored (NQ)` (Pink): Remains the most volatile of the Q-Anchored group, with significant dips (e.g., to ~60% near layer 25).
* **A-Anchored Series (Dashed Lines):** Performance remains low and volatile, largely mirroring the patterns seen in v0.1, with accuracies mostly between 10% and 50%.
* The relative ordering and volatility of the four A-Anchored lines appear consistent with the v0.1 chart.
### Key Observations
1. **Method Dominance:** The most striking pattern is the large, consistent gap between **Q-Anchored** (solid lines) and **A-Anchored** (dashed lines) methods across all layers and both model versions. Q-Anchored methods achieve 60-100% accuracy, while A-Anchored methods struggle to exceed 50%.
2. **Layer Sensitivity:** Accuracy for Q-Anchored methods is extremely sensitive to the specific layer, showing high-frequency volatility. This suggests the model's internal representations for these tasks are not monotonically improving but fluctuate significantly.
3. **Model Version Comparison:** While the overall patterns are similar, Mistral-7B-v0.3 (right chart) shows signs of improvement for certain Q-Anchored tasks. Notably, `Q-Anchored (HotpotQA)` (purple) and `Q-Anchored (TriviaQA)` (green) appear to reach and sustain higher accuracy levels more consistently in v0.3 compared to v0.1.
4. **Dataset Difficulty:** Under the A-Anchored method, performance is uniformly poor across datasets. Under the Q-Anchored method, `NQ` (pink) appears to be the most challenging dataset, exhibiting the largest and most frequent drops in accuracy.
### Interpretation
This visualization provides a technical diagnostic of how knowledge is accessed and utilized across the layers of two Mistral-7B model versions. The data strongly suggests that the **Q-Anchored prompting/evaluation method is far more effective** at eliciting correct answers from the model's internal states than the A-Anchored method. The high volatility across layers indicates that the "knowledge" or "capability" to answer these questions is not stored in a smooth, progressive manner but is instead distributed in a complex, non-linear fashion throughout the network, with specific layers being "hotspots" for certain types of queries.
The comparison between v0.1 and v0.3 hints at **iterative model improvement**. The increased stability and peak performance for datasets like HotpotQA and TriviaQA in v0.3 suggest that the update may have refined how the model processes or retrieves multi-hop (HotpotQA) and factual (TriviaQA) information. However, the persistent volatility and the unchanged poor performance of A-Anchored methods indicate that fundamental characteristics of the model's architecture or training data still impose limits on consistent performance. This type of analysis is crucial for understanding model internals, debugging failure modes, and guiding future model development.
DECODING INTELLIGENCE...