## Line Chart: Answer Accuracy Across Layers for Mistral-7B Models
### Overview
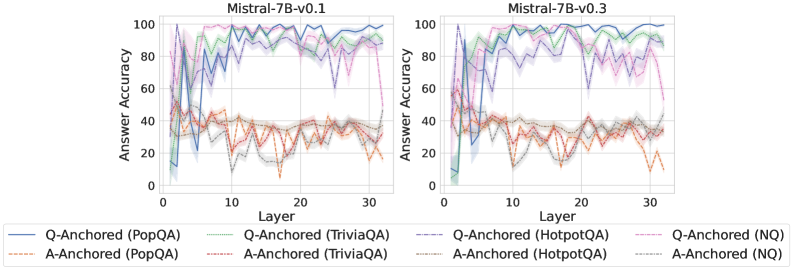
The image contains two side-by-side line charts comparing answer accuracy across layers (0–30) for two versions of the Mistral-7B model (v0.1 and v0.3). Each chart includes multiple data series representing different anchoring strategies (Q-Anchored and A-Anchored) and datasets (PopQA, TriviaQA, HotpotQA, NQ). The y-axis measures answer accuracy (0–100%), and the x-axis represents model layers.
---
### Components/Axes
- **Left Chart Title**: "Mistral-7B-v0.1"
- **Right Chart Title**: "Mistral-7B-v0.3"
- **Y-Axis**: "Answer Accuracy" (0–100%)
- **X-Axis**: "Layer" (0–30)
- **Legend**: Located at the bottom of both charts, with the following entries:
- **Solid Lines**:
- Blue: Q-Anchored (PopQA)
- Green: Q-Anchored (TriviaQA)
- Purple: Q-Anchored (HotpotQA)
- Pink: Q-Anchored (NQ)
- **Dashed Lines**:
- Orange: A-Anchored (PopQA)
- Red: A-Anchored (TriviaQA)
- Gray: A-Anchored (HotpotQA)
- Black: A-Anchored (NQ)
---
### Detailed Analysis
#### Mistral-7B-v0.1 (Left Chart)
- **Q-Anchored (PopQA)**: Starts at ~80% accuracy, dips sharply to ~40% at layer 5, then stabilizes near 80% by layer 30.
- **A-Anchored (PopQA)**: Peaks at ~60% at layer 10, drops to ~20% at layer 15, and fluctuates between 20–40% thereafter.
- **Q-Anchored (TriviaQA)**: Begins at ~70%, dips to ~50% at layer 10, then rises to ~80% by layer 30.
- **A-Anchored (TriviaQA)**: Starts at ~50%, drops to ~30% at layer 5, and stabilizes near 40% by layer 30.
- **Q-Anchored (HotpotQA)**: Peaks at ~90% at layer 10, drops to ~60% at layer 15, then recovers to ~80% by layer 30.
- **A-Anchored (HotpotQA)**: Starts at ~60%, dips to ~40% at layer 10, and fluctuates between 40–60% thereafter.
- **Q-Anchored (NQ)**: Starts at ~75%, dips to ~50% at layer 10, then rises to ~85% by layer 30.
- **A-Anchored (NQ)**: Begins at ~55%, drops to ~35% at layer 10, and stabilizes near 50% by layer 30.
#### Mistral-7B-v0.3 (Right Chart)
- **Q-Anchored (PopQA)**: Starts at ~85%, dips to ~60% at layer 10, then stabilizes near 90% by layer 30.
- **A-Anchored (PopQA)**: Peaks at ~65% at layer 10, drops to ~40% at layer 15, and fluctuates between 40–60% thereafter.
- **Q-Anchored (TriviaQA)**: Begins at ~75%, dips to ~55% at layer 10, then rises to ~85% by layer 30.
- **A-Anchored (TriviaQA)**: Starts at ~55%, drops to ~35% at layer 10, and stabilizes near 50% by layer 30.
- **Q-Anchored (HotpotQA)**: Peaks at ~95% at layer 10, drops to ~70% at layer 15, then recovers to ~90% by layer 30.
- **A-Anchored (HotpotQA)**: Starts at ~65%, dips to ~45% at layer 10, and fluctuates between 45–65% thereafter.
- **Q-Anchored (NQ)**: Starts at ~80%, dips to ~60% at layer 10, then rises to ~90% by layer 30.
- **A-Anchored (NQ)**: Begins at ~60%, drops to ~40% at layer 10, and stabilizes near 60% by layer 30.
---
### Key Observations
1. **Version Comparison**:
- Mistral-7B-v0.3 shows more stable and higher accuracy trends compared to v0.1, particularly for Q-Anchored models.
- A-Anchored models in v0.3 exhibit slightly improved stability but remain lower than Q-Anchored counterparts.
2. **Dataset Performance**:
- **PopQA**: Q-Anchored models consistently outperform A-Anchored across both versions.
- **HotpotQA**: Q-Anchored models achieve the highest accuracy (up to ~95% in v0.3), while A-Anchored models lag significantly.
- **NQ**: Q-Anchored models show the most pronounced improvement in v0.3, reaching ~90% accuracy.
3. **Layer Trends**:
- Accuracy often peaks around layer 10–15, followed by fluctuations.
- Sharp drops (e.g., layer 5–10) suggest potential instability in early layers for certain datasets.
---
### Interpretation
The data demonstrates that **Q-Anchored models consistently outperform A-Anchored models** across all datasets and versions, with the gap widening in Mistral-7B-v0.3. The improved stability in v0.3 suggests architectural or training enhancements, particularly for complex datasets like HotpotQA and NQ. The layer-wise fluctuations highlight the importance of early-layer performance, as drops in accuracy at layers 5–10 correlate with lower overall performance. These trends underscore the effectiveness of Q-Anchored strategies in maintaining high accuracy, while A-Anchored models may require further optimization for robustness.