\n
## Diagram: Path Comparison - Optimal vs. Model
### Overview
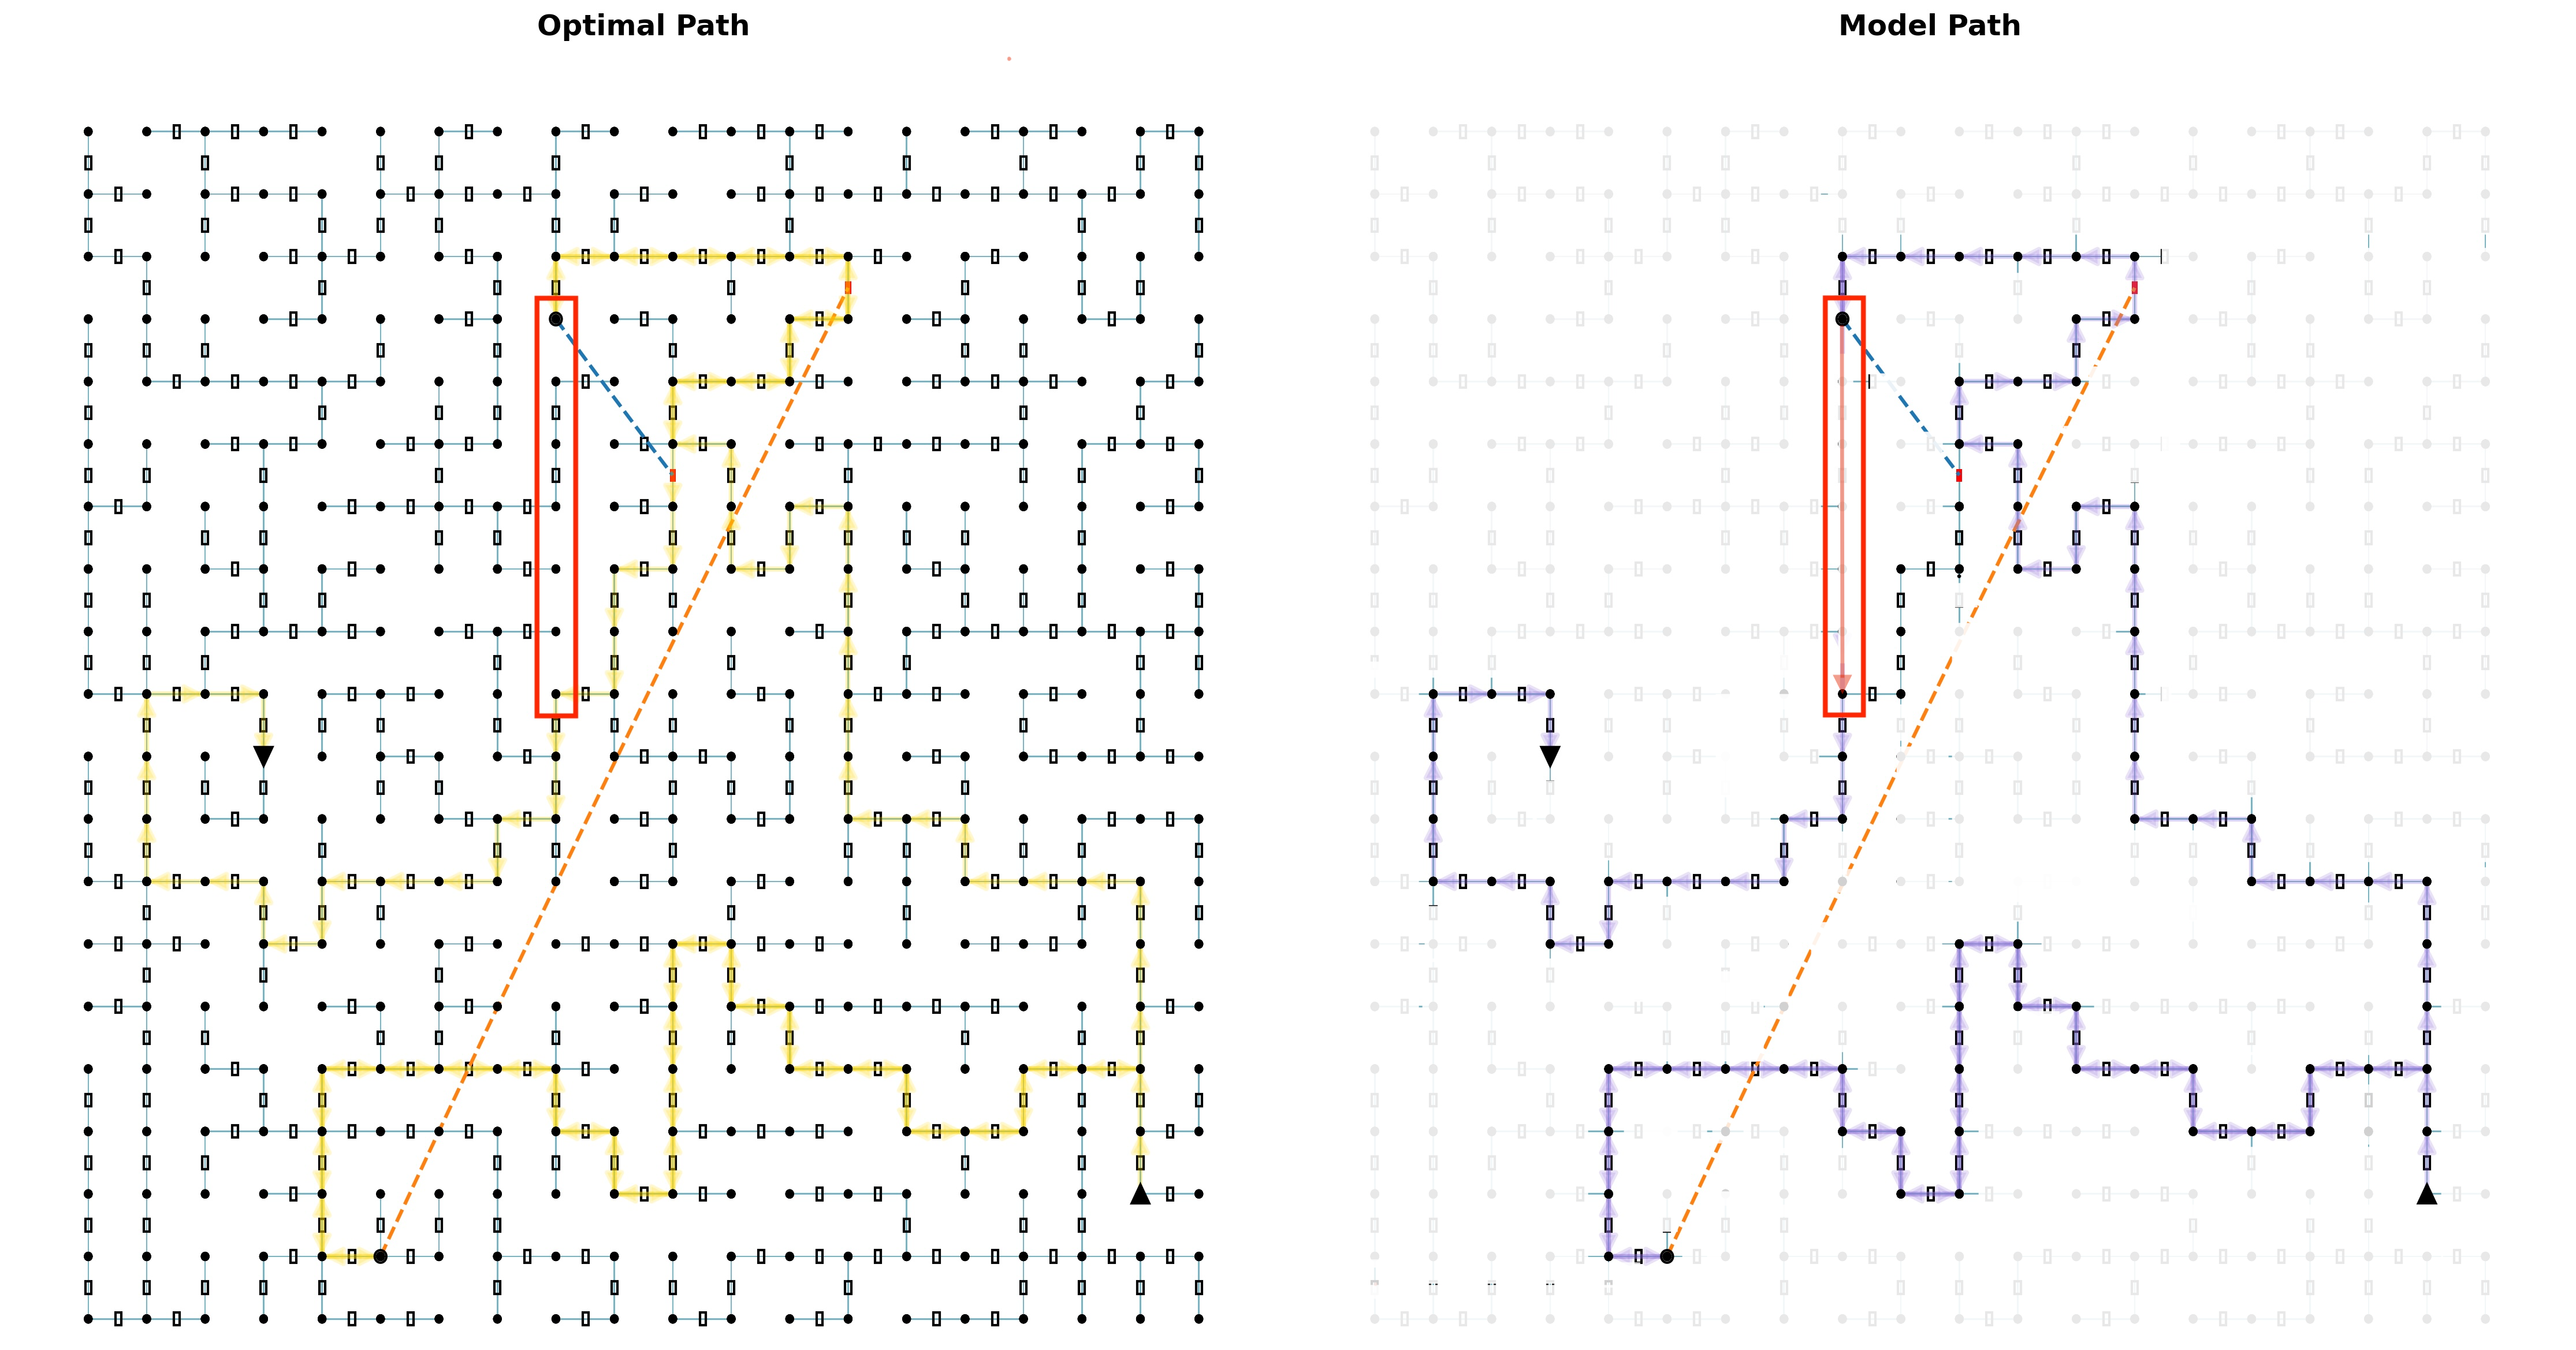
The image presents a comparison between an "Optimal Path" and a "Model Path" through a grid-like environment. Both paths start at the bottom-left corner and end at the top-right corner. The environment consists of a dense grid of small squares, with the paths highlighted by connected lines. The "Optimal Path" is shown in yellow, and the "Model Path" is shown in blue, with a red dashed line indicating a shared initial segment. There are also triangular markers along both paths.
### Components/Axes
The diagram lacks explicit axes or scales. It is a visual representation of paths within a 2D grid. The key components are:
* **Grid:** A uniform grid of small squares representing the environment.
* **Optimal Path:** Highlighted in yellow, representing the shortest or most efficient path.
* **Model Path:** Highlighted in blue, representing the path generated by a model.
* **Shared Initial Segment:** A red dashed line indicating the overlap between the Optimal and Model paths at the beginning.
* **Start Point:** Bottom-left corner of the grid.
* **End Point:** Top-right corner of the grid.
* **Markers:** Triangular markers are placed along both paths, potentially indicating key points or steps.
### Detailed Analysis or Content Details
The grid appears to be approximately 30x30 squares.
**Optimal Path (Yellow):**
The Optimal Path follows a relatively straight diagonal line from the start to the end. It consists of approximately 30 segments. The path is smooth and direct.
**Model Path (Blue):**
The Model Path deviates significantly from a straight line. It exhibits several sharp turns and horizontal/vertical movements. It consists of approximately 50 segments.
* The initial segment of the Model Path overlaps with the Optimal Path, indicated by the red dashed line. This overlap lasts for approximately 5 segments.
* After the initial overlap, the Model Path makes a sharp turn to the right, then proceeds upwards with several horizontal segments.
* The Model Path then makes a sharp turn to the left and continues upwards with more horizontal segments.
* The final segment of the Model Path is a diagonal line towards the end point.
**Markers (Triangles):**
* The Optimal Path has triangular markers placed at roughly equal intervals along its length. There are approximately 10 markers.
* The Model Path also has triangular markers, but they are more sparsely distributed and appear to be placed at points where the path changes direction. There are approximately 7 markers.
### Key Observations
* The Model Path is significantly longer and more convoluted than the Optimal Path.
* The Model Path initially follows the Optimal Path but quickly diverges.
* The Model Path exhibits a tendency to move horizontally before changing direction.
* The markers on the Optimal Path suggest a consistent step size, while the markers on the Model Path highlight changes in direction.
### Interpretation
This diagram likely illustrates the performance of a pathfinding algorithm or a reinforcement learning agent. The Optimal Path represents the ideal solution, while the Model Path represents the solution generated by the algorithm/agent. The significant difference in path length and complexity suggests that the model is not yet performing optimally. The initial overlap indicates that the model can initially identify the correct direction, but it struggles to maintain a straight path and efficiently reach the goal. The horizontal movements in the Model Path could indicate a bias in the algorithm or a difficulty in navigating the environment. The placement of markers suggests that the model is making decisions at discrete steps, and the markers highlight these decision points. The diagram demonstrates a clear gap between the ideal solution and the model's performance, highlighting areas for improvement in the algorithm or agent's training.