## Diagram Type: Flowchart
### Overview
The image depicts a flowchart that illustrates a process involving the transformation of data through a series of operations. The flowchart is composed of arrows that indicate the direction of data flow and labels that describe each step.
### Components/Axes
- **Arrows**: Indicate the direction of data flow.
- **Labels**: Describe each step in the process.
- **Data Points**: Represent the input and output of each step.
### Detailed Analysis or ### Content Details
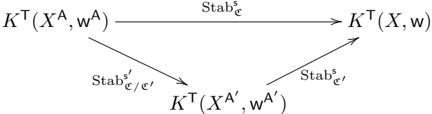
- **Step 1**: The process begins with the input data \( K^T(X^A, w^A) \).
- **Step 2**: The data is transformed through a process labeled \( Stab^s_{\epsilon} \).
- **Step 3**: The transformed data is then passed through another process labeled \( Stab^s_{\epsilon'} \).
- **Step 4**: The final output is \( K^T(X, w) \).
### Key Observations
- The flowchart shows a sequential process with two stages of transformation.
- The labels \( Stab^s_{\epsilon} \) and \( Stab^s_{\epsilon'} \) suggest that the transformation involves some form of stabilization or stabilization process.
- The input and output data points are represented by \( K^T(X^A, w^A) \) and \( K^T(X, w) \), respectively.
### Interpretation
The flowchart demonstrates a process where data is transformed through a series of stabilization steps. The input data is first stabilized through \( Stab^s_{\epsilon} \), and then through \( Stab^s_{\epsilon'} \) to produce the final output. The interpretation of this process would depend on the specific context in which it is used, but it generally suggests a method for stabilizing data before further processing or analysis.