## Chart: o4-mini Distribution Comparison
### Overview
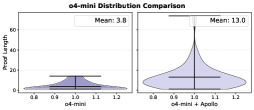
The image presents a side-by-side comparison of two violin plots, illustrating the distribution of "Proof Length" for "o4-mini" and "o4-mini + Apollo". The y-axis represents "Proof Length", while the x-axis represents the respective configurations. Each plot displays the distribution shape, median, and interquartile range, along with the mean value.
### Components/Axes
* **Title:** o4-mini Distribution Comparison
* **Y-axis:** Proof Length, ranging from 0 to 60.
* **X-axis (Left Plot):** o4-mini, ranging from 0.8 to 1.2.
* **X-axis (Right Plot):** o4-mini + Apollo, ranging from 0.8 to 1.2.
* **Violin Plots:** Shaded areas representing the distribution of proof lengths.
* **Median Lines:** Horizontal lines within each violin plot indicating the median proof length.
* **Interquartile Range (IQR):** Boxes around the median lines representing the IQR.
* **Mean Values:** Text boxes indicating the mean proof length for each configuration.
### Detailed Analysis
**Left Plot: o4-mini**
* **Mean:** 3.8
* The distribution is concentrated between approximately 0.8 and 1.2 on the x-axis.
* The median is approximately 4.
* The IQR spans roughly from 2 to 6.
**Right Plot: o4-mini + Apollo**
* **Mean:** 13.0
* The distribution is concentrated between approximately 0.8 and 1.2 on the x-axis.
* The median is approximately 12.
* The IQR spans roughly from 8 to 16.
### Key Observations
* The "o4-mini + Apollo" configuration exhibits a significantly higher mean and median proof length compared to "o4-mini".
* The distribution for "o4-mini + Apollo" appears to be more spread out, with a longer tail extending towards higher proof lengths.
* Both distributions are centered around 1.0 on the x-axis.
### Interpretation
The data suggests that adding "Apollo" to the "o4-mini" configuration results in a substantial increase in proof length. The violin plots visually demonstrate the shift in the distribution, with "o4-mini + Apollo" having a higher central tendency and greater variability. This could indicate that the addition of "Apollo" introduces more complex or lengthy proofs. The difference in mean values (3.8 vs. 13.0) highlights the magnitude of this effect.