## Violin Plot: o4-mini Distribution Comparison
### Overview
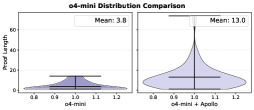
This image displays a side-by-side violin plot comparing the distribution of a metric called "Proof Length" between two distinct system configurations: a base model ("o4-mini") and an augmented model ("o4-mini + Apollo"). The charts visually demonstrate the density, range, and mean of the data for both configurations.
### Components/Axes
**Header Region:**
* **Main Title:** "o4-mini Distribution Comparison" (Located top-center).
**Y-Axis (Shared visually across both plots):**
* **Title:** "Proof Length" (Located vertically on the far left).
* **Scale/Markers:** Numerical ticks at `0`, `20`, `40`, and `60`. Faint horizontal grid lines extend across both plots at these intervals.
**Left Subplot (Base Model):**
* **X-Axis Title:** "o4-mini" (Located bottom-center of the left plot).
* **X-Axis Markers:** `0.8`, `0.9`, `1.0`, `1.1`, `1.2`. *(Note: In violin plots, these represent the spatial width/density bounds centered around the categorical x-value of 1.0, rather than a measured data variable).*
* **Annotation/Legend:** A white bounding box in the top-right corner of this subplot contains the text: "Mean: 3.8".
**Right Subplot (Augmented Model):**
* **X-Axis Title:** "o4-mini + Apollo" (Located bottom-center of the right plot).
* **X-Axis Markers:** `0.8`, `0.9`, `1.0`, `1.1`, `1.2`.
* **Annotation/Legend:** A white bounding box in the top-right corner of this subplot contains the text: "Mean: 13.0".
### Detailed Analysis
**1. Left Plot: "o4-mini"**
* **Visual Trend:** The distribution shape is heavily bottom-weighted, resembling a flattened, wide base that tapers off abruptly. It indicates a high concentration of data points at very low values with minimal variance.
* **Data Points (Approximate):**
* **Minimum Value:** ~0.
* **Maximum Value (Top Whisker/Cap):** ~15.
* **Density Peak (Widest point):** ~2 to ~5.
* **Central Horizontal Bar (Median):** ~4.
* **Explicit Mean:** 3.8.
**2. Right Plot: "o4-mini + Apollo"**
* **Visual Trend:** The distribution shape is significantly taller and wider overall compared to the left plot. It features a bulbous base that transitions into a pronounced, elongated upper tail. This indicates a much wider spread of data, a higher average, and the presence of high-value outliers.
* **Data Points (Approximate):**
* **Minimum Value:** ~0.
* **Maximum Value (Top Whisker/Cap):** ~75 (The vertical line extends well past the 60 grid line).
* **Density Peak (Widest point):** ~8 to ~15.
* **Central Horizontal Bar (Median):** ~12.
* **Explicit Mean:** 13.0.
### Key Observations
* **Mean Shift:** The addition of "Apollo" increases the mean Proof Length from 3.8 to 13.0, an increase of approximately 342%.
* **Range Expansion:** The maximum observed Proof Length jumps from roughly 15 in the base model to roughly 75 in the augmented model, a 5x increase in the upper bound.
* **Variance:** The "o4-mini" model is highly consistent, producing short lengths almost exclusively. The "o4-mini + Apollo" model exhibits high variance, producing a wide variety of lengths, including a long tail of exceptionally long proofs.
### Interpretation
The data clearly demonstrates the behavioral impact of adding the "Apollo" component to the "o4-mini" system. Assuming "o4-mini" is a Large Language Model (LLM) and "Proof Length" refers to the number of steps, tokens, or logical deductions generated to solve a problem, the base model tends to provide very brief, concise outputs.
The introduction of "Apollo"—which is likely a reasoning framework (like Chain-of-Thought), a search/retrieval agent, or a formal verification tool—forces or enables the model to "show its work." Consequently, the augmented system generates significantly longer, more elaborate proofs.
The long upper tail in the right-hand plot is particularly notable. It suggests that while Apollo usually increases the proof length to a moderate degree (around 10-20 units), it occasionally encounters complex edge cases that trigger massive expansions in reasoning, pushing the proof length up to 60-75 units. The base model lacks the capacity or prompting to ever reach these lengths, hard-capping at around 15.