\n
## Violin Plot: o4-mini Distribution Comparison
### Overview
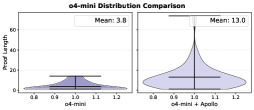
The image presents a side-by-side comparison of two violin plots, visualizing the distribution of "Proof Length" for two conditions: "o4-mini" and "o4-mini + Apollo". Each plot also displays a horizontal line indicating the mean value.
### Components/Axes
* **X-axis:** Labels "o4-mini" (left plot) and "o4-mini + Apollo" (right plot). The scale appears to range from approximately 0.8 to 1.2.
* **Y-axis:** Labeled "Proof Length", with a scale ranging from approximately 0 to 60.
* **Violin Plots:** Two violin plots, one for each condition. The width of the violin represents the density of the data at each Proof Length value.
* **Mean Indicators:** Horizontal lines within each violin plot, with text labels indicating the mean value.
* **Title:** "o4-mini Distribution Comparison" positioned at the top-center of the image.
### Detailed Analysis
**Left Plot (o4-mini):**
* The violin plot is relatively narrow, indicating a concentrated distribution of Proof Length values.
* The plot is centered around a value of approximately 1.0.
* The mean is indicated as 3.8.
* The violin extends from approximately 0.8 to 1.2 on the x-axis, and from 0 to approximately 20 on the y-axis.
**Right Plot (o4-mini + Apollo):**
* The violin plot is wider and taller than the left plot, indicating a more dispersed distribution of Proof Length values.
* The plot is centered around a value of approximately 1.05.
* The mean is indicated as 13.0.
* The violin extends from approximately 0.8 to 1.2 on the x-axis, and from 0 to approximately 60 on the y-axis.
### Key Observations
* The "o4-mini + Apollo" condition exhibits a significantly wider distribution of Proof Length values compared to the "o4-mini" condition.
* The mean Proof Length is substantially higher for the "o4-mini + Apollo" condition (13.0) than for the "o4-mini" condition (3.8).
* The left plot shows a more concentrated distribution, while the right plot shows a more spread-out distribution.
### Interpretation
The data suggests that adding "Apollo" to "o4-mini" significantly impacts the distribution of Proof Length. Specifically, it leads to a wider range of Proof Length values and a much higher average Proof Length. This could indicate that "Apollo" introduces more complexity or variability into the proof generation process, or that it allows for the creation of longer proofs. The difference in the shapes of the violin plots suggests that the underlying distributions are different, and a statistical test could be used to confirm this. The large difference in means (3.8 vs 13.0) is a strong indicator of a meaningful effect. The y-axis scale is important to note, as the right plot extends much further, indicating the potential for significantly longer proofs with the addition of Apollo.