## Violin Plot: o4-mini Distribution Comparison
### Overview
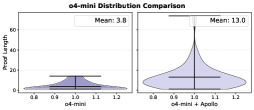
The image contains two side-by-side violin plots comparing the distribution of "o4-mini" and "o4-mini + Apollo" metrics. The left plot represents the baseline "o4-mini" distribution, while the right plot shows the modified "o4-mini + Apollo" distribution. Both plots use the y-axis to represent "Proof Length" and the x-axis to represent the respective distributions.
### Components/Axes
- **Title**: "o4-mini Distribution Comparison" (centered at the top)
- **Left Plot**:
- **X-axis label**: "o4-mini" (horizontal axis)
- **Y-axis label**: "Proof Length" (vertical axis)
- **Mean annotation**: "Mean: 3.8" (top-right corner of the plot)
- **Right Plot**:
- **X-axis label**: "o4-mini + Apollo" (horizontal axis)
- **Y-axis label**: "Proof Length" (vertical axis)
- **Mean annotation**: "Mean: 13.0" (top-right corner of the plot)
- **Violin Plot Structure**:
- Shaded areas represent probability density
- Black horizontal lines indicate the interquartile range (IQR)
- Vertical black lines mark the mean values
### Detailed Analysis
- **Left Plot (o4-mini)**:
- **Distribution**: Narrow and symmetric, concentrated around x=1.0
- **Mean**: 3.8 (annotated in a box)
- **Spread**: Minimal variability, with most data points clustered tightly
- **IQR**: Approximately 0.9–1.1 (black line within the violin)
- **Right Plot (o4-mini + Apollo)**:
- **Distribution**: Broad and asymmetric, with a pronounced peak near x=1.0 and a long tail extending to x=1.2
- **Mean**: 13.0 (annotated in a box)
- **Spread**: High variability, with data points spanning 0.8–1.2
- **IQR**: Approximately 0.9–1.1 (black line within the violin)
- **Outlier**: A single extreme value at x=1.2 (top of the violin)
### Key Observations
1. **Mean Shift**: The mean proof length increases dramatically from 3.8 (o4-mini) to 13.0 (o4-mini + Apollo).
2. **Variability**: The "o4-mini + Apollo" distribution shows significantly greater spread, with a long right tail indicating extreme values.
3. **Concentration**: The baseline "o4-mini" distribution is tightly clustered, while the modified version exhibits broader dispersion.
4. **IQR Consistency**: Both plots share a similar IQR range (0.9–1.1), suggesting comparable central tendencies despite the mean difference.
### Interpretation
The data suggests that the addition of "Apollo" to the "o4-mini" system introduces substantial complexity or variability in proof length calculations. The mean increase from 3.8 to 13.0 implies that Apollo either:
- Increases computational demands (e.g., longer proofs for the same task), or
- Introduces new constraints that require more extensive reasoning.
The long tail in the "o4-mini + Apollo" distribution indicates that a subset of cases requires disproportionately longer proofs, potentially highlighting edge cases or inefficiencies in the modified system. This could signal a need for optimization or further investigation into the interaction between "o4-mini" and Apollo components.