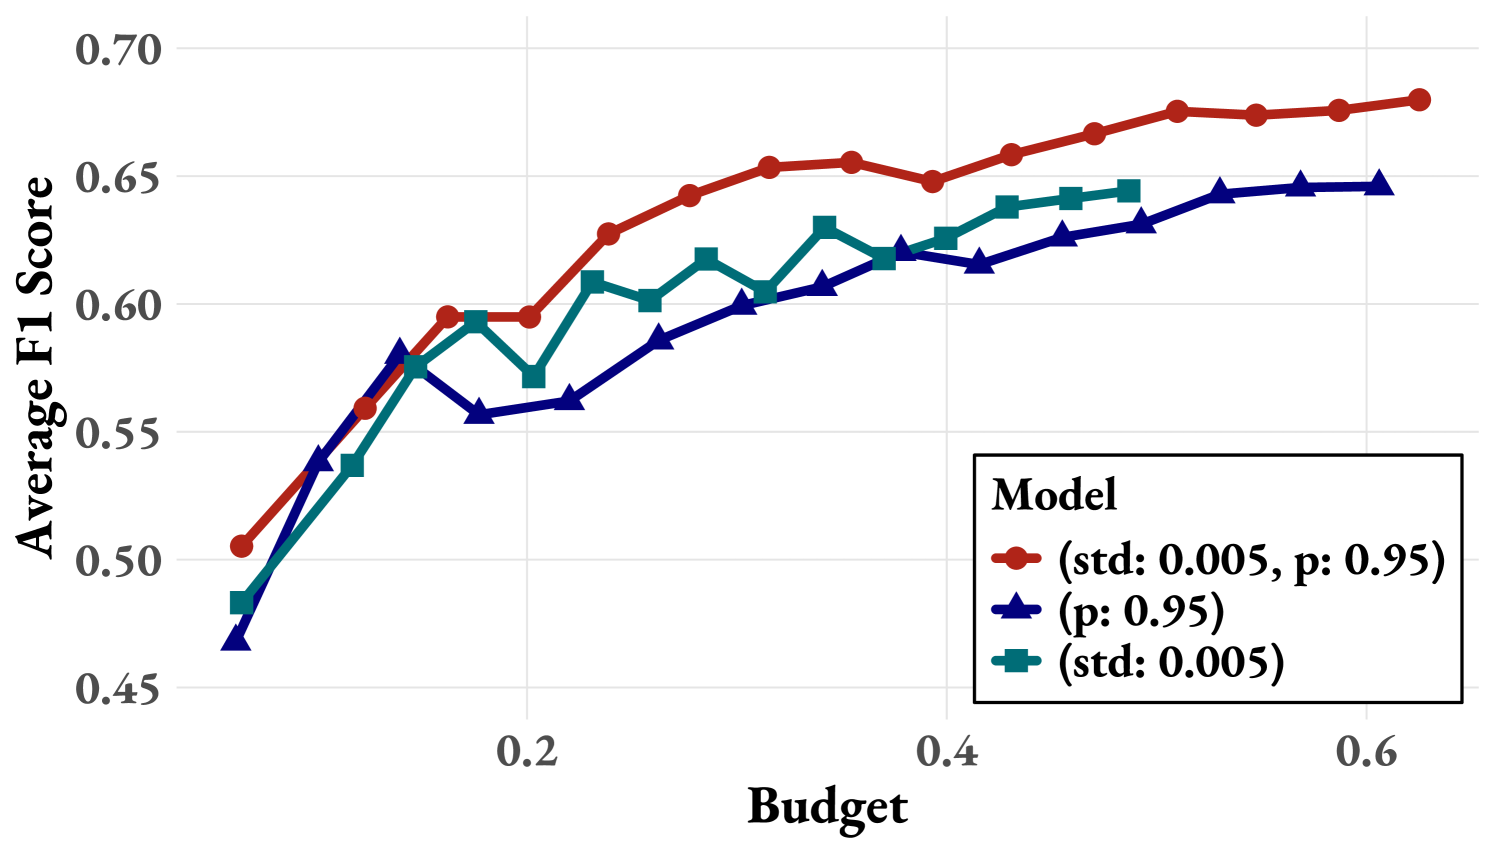
## Line Chart: Average F1 Score vs. Budget for Different Models
### Overview
The image is a line chart comparing the average F1 score of three different models as a function of budget. The chart displays how the performance of each model changes with increasing budget allocation. The models are distinguished by their standard deviation (std) and p-value (p).
### Components/Axes
* **X-axis (Horizontal):** "Budget". The scale ranges from approximately 0 to 0.6, with tick marks at 0.2, 0.4, and 0.6.
* **Y-axis (Vertical):** "Average F1 Score". The scale ranges from 0.45 to 0.70, with tick marks at 0.45, 0.50, 0.55, 0.60, 0.65, and 0.70.
* **Legend (Bottom-Right):** A box labeled "Model" that identifies the three models represented by different colored lines:
* Red line with circle markers: "(std: 0.005, p: 0.95)"
* Blue line with triangle markers: "(p: 0.95)"
* Teal line with square markers: "(std: 0.005)"
### Detailed Analysis
* **Red Line (std: 0.005, p: 0.95):** This line generally slopes upward, indicating an increase in the average F1 score as the budget increases.
* At a budget of approximately 0.1, the F1 score is around 0.51.
* At a budget of approximately 0.2, the F1 score is around 0.60.
* At a budget of approximately 0.4, the F1 score is around 0.65.
* At a budget of approximately 0.6, the F1 score is around 0.68.
* **Blue Line (p: 0.95):** This line also slopes upward, showing an improvement in the average F1 score with increasing budget.
* At a budget of approximately 0.1, the F1 score is around 0.47.
* At a budget of approximately 0.2, the F1 score is around 0.56.
* At a budget of approximately 0.4, the F1 score is around 0.62.
* At a budget of approximately 0.6, the F1 score is around 0.65.
* **Teal Line (std: 0.005):** This line shows an upward trend, similar to the other two lines.
* At a budget of approximately 0.1, the F1 score is around 0.48.
* At a budget of approximately 0.2, the F1 score is around 0.59.
* At a budget of approximately 0.4, the F1 score is around 0.64.
* At a budget of approximately 0.6, the F1 score is around 0.65.
### Key Observations
* The red line (std: 0.005, p: 0.95) consistently outperforms the other two models across the range of budgets.
* The blue line (p: 0.95) generally has the lowest average F1 score compared to the other two models.
* All three models show diminishing returns as the budget increases, with the rate of improvement slowing down at higher budget levels.
* The teal line (std: 0.005) and the blue line (p: 0.95) converge to similar F1 scores at higher budget levels.
### Interpretation
The chart demonstrates the relationship between budget allocation and model performance, as measured by the average F1 score. The model with (std: 0.005, p: 0.95) appears to be the most effective, achieving the highest F1 scores across different budget levels. The diminishing returns suggest that there is a point beyond which increasing the budget yields only marginal improvements in model performance. The convergence of the teal and blue lines at higher budgets indicates that the impact of 'p' becomes less significant as the budget increases, while the standard deviation remains a more critical factor.