## Line Chart: Model Performance vs. Budget
### Overview
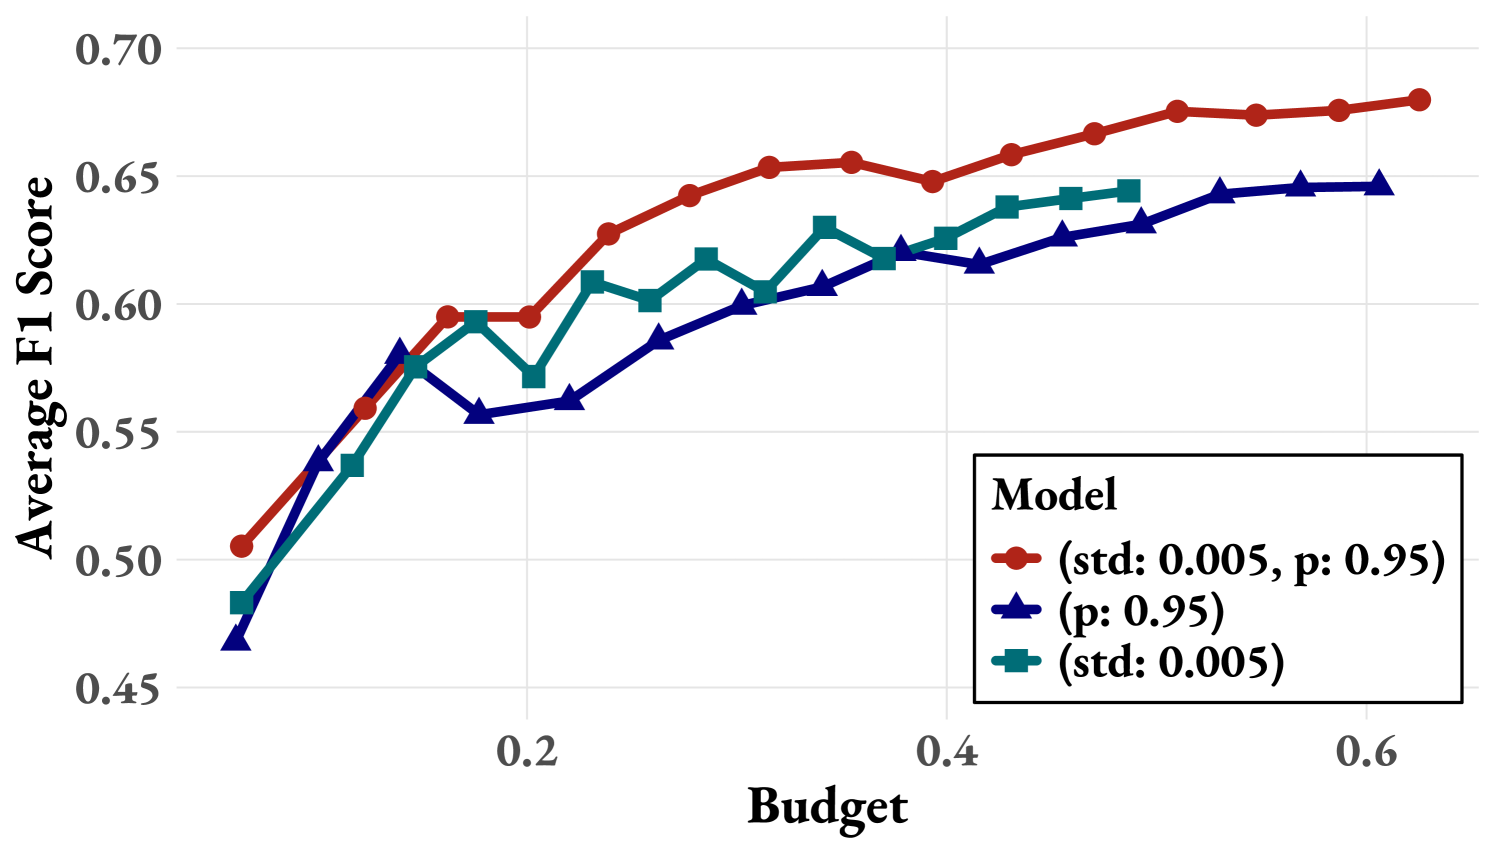
The chart illustrates the relationship between budget allocation and average F1 score for three distinct models. The x-axis represents budget (0.0 to 0.6), while the y-axis shows average F1 score (0.45 to 0.70). Three data series are plotted with distinct markers and colors, each corresponding to specific model configurations.
### Components/Axes
- **X-axis (Budget)**: Continuous scale from 0.0 to 0.6, labeled "Budget"
- **Y-axis (Average F1 Score)**: Continuous scale from 0.45 to 0.70, labeled "Average F1 Score"
- **Legend**: Located in bottom-right corner, with three entries:
- Red circles: (std: 0.005, p: 0.95)
- Blue triangles: (p: 0.95)
- Teal squares: (std: 0.005)
### Detailed Analysis
1. **Red Line (std: 0.005, p: 0.95)**:
- Starts at 0.50 when budget = 0.0
- Gradually increases to 0.68 at budget = 0.6
- Maintains consistent upward trajectory with minimal fluctuations
- Highest performance across all budget levels
2. **Blue Line (p: 0.95)**:
- Begins at 0.47 when budget = 0.0
- Sharp initial increase to 0.58 at budget = 0.1
- Plateaus between 0.60-0.62 from budget = 0.3 to 0.6
- Shows diminishing returns after initial budget increase
3. **Teal Line (std: 0.005)**:
- Starts at 0.48 when budget = 0.0
- Reaches 0.58 at budget = 0.1
- Exhibits moderate fluctuations (e.g., 0.60 → 0.59 → 0.62)
- Ends at 0.65 when budget = 0.6
- Maintains second-highest performance overall
### Key Observations
- Red line demonstrates optimal performance, maintaining a 0.08-0.10 F1 score advantage over other models at higher budgets
- Blue line shows strongest initial response to budget increases but fails to sustain momentum
- Teal line exhibits moderate performance with slight volatility but remains stable
- All models show diminishing returns beyond budget = 0.4
- Red line's performance suggests optimal configuration for std=0.005 and p=0.95
### Interpretation
The data indicates that model performance improves with increased budget allocation, with the red configuration (std=0.005, p: 0.95) achieving superior results across all budget levels. The blue line's initial performance spike suggests potential overfitting or configuration-specific advantages that don't translate to sustained gains. The teal line's moderate performance with std=0.005 implies that standard deviation alone doesn't guarantee optimal results without complementary parameter tuning. The consistent performance of the red line across budgets suggests that this configuration effectively balances model complexity and generalization capability. The plateau observed in the blue line after budget=0.3 may indicate resource saturation or diminishing returns in the model's optimization landscape.