## Bar Chart: The Accuracy of Different Operation Sets
### Overview
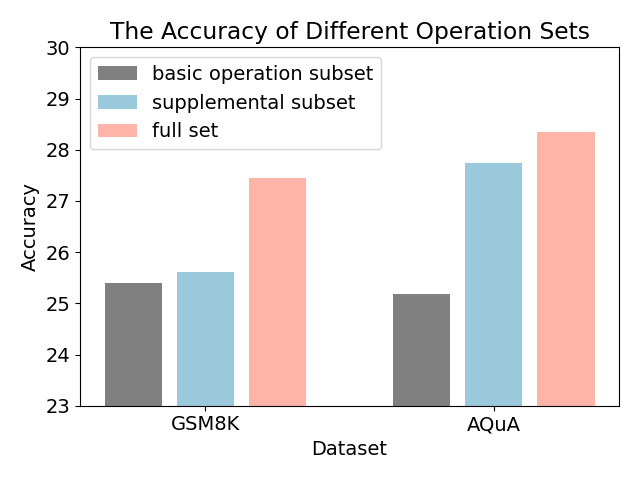
The image is a bar chart comparing the accuracy of three different operation sets (basic operation subset, supplemental subset, and full set) across two datasets (GSM8K and AQUA). The y-axis represents accuracy, ranging from 23 to 30. The x-axis represents the dataset.
### Components/Axes
* **Title:** The Accuracy of Different Operation Sets
* **X-axis:** Dataset, with categories GSM8K and AQUA.
* **Y-axis:** Accuracy, ranging from 23 to 30, with tick marks at each integer value.
* **Legend:** Located in the top-left corner.
* Gray: basic operation subset
* Light Blue: supplemental subset
* Light Red: full set
### Detailed Analysis
* **GSM8K Dataset:**
* basic operation subset (Gray): Accuracy is approximately 25.4.
* supplemental subset (Light Blue): Accuracy is approximately 25.6.
* full set (Light Red): Accuracy is approximately 27.5.
* **AQUA Dataset:**
* basic operation subset (Gray): Accuracy is approximately 25.2.
* supplemental subset (Light Blue): Accuracy is approximately 27.8.
* full set (Light Red): Accuracy is approximately 28.3.
### Key Observations
* For both datasets, the "full set" operation set achieves the highest accuracy.
* The "basic operation subset" has the lowest accuracy for both datasets.
* The AQUA dataset generally shows higher accuracy across all operation sets compared to the GSM8K dataset.
* The supplemental subset shows a larger increase in accuracy from GSM8K to AQUA compared to the other two sets.
### Interpretation
The bar chart illustrates the performance of different operation sets on two datasets. The "full set" consistently outperforms the other subsets, suggesting that a more comprehensive set of operations leads to higher accuracy. The AQUA dataset appears to be more amenable to these operations, as all sets achieve higher accuracy on it compared to GSM8K. The supplemental subset seems to benefit the most from the change in dataset, indicating that the additional operations in this subset are particularly effective for the AQUA dataset.