## Flow Diagram: Hypothesis, Fundamental Objects, and Methods
### Overview
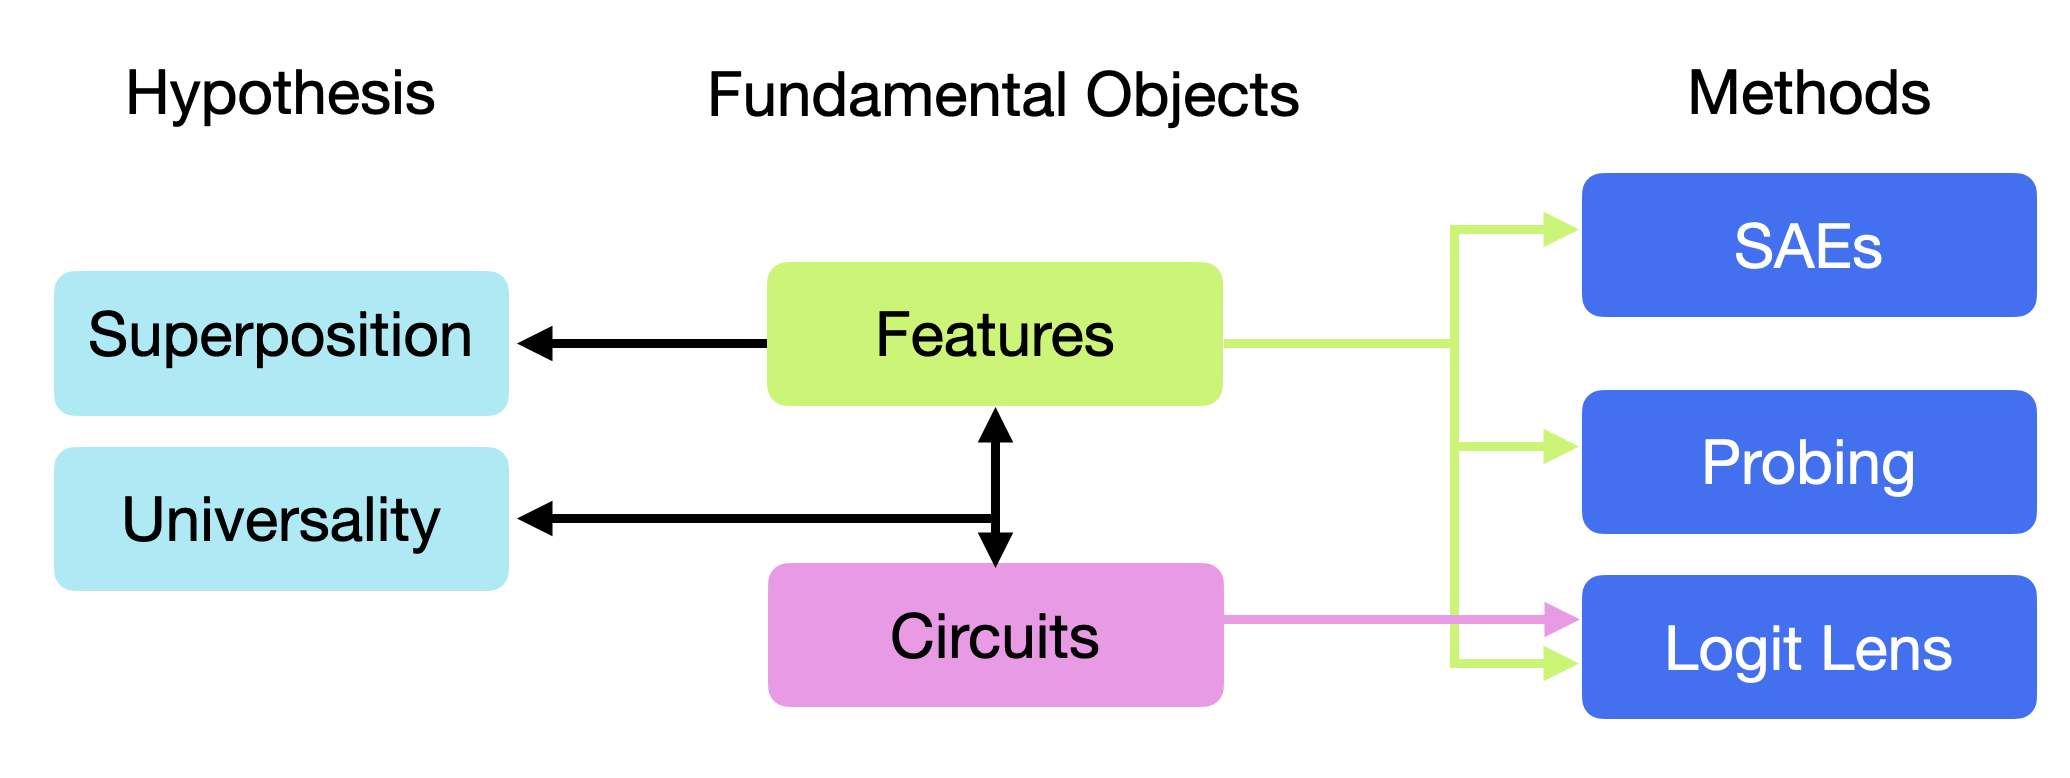
The image is a flow diagram illustrating the relationships between hypotheses, fundamental objects, and methods. It shows how hypotheses relate to fundamental objects (features and circuits), and how these objects are analyzed using different methods.
### Components/Axes
* **Titles:**
* Hypothesis (left)
* Fundamental Objects (center)
* Methods (right)
* **Hypothesis:**
* Superposition (light blue box)
* Universality (light blue box)
* **Fundamental Objects:**
* Features (light green box)
* Circuits (light purple box)
* **Methods:**
* SAEs (dark blue box)
* Probing (dark blue box)
* Logit Lens (dark blue box)
* **Arrows:**
* Black arrows indicate a two-way relationship between Features and Circuits, and a one-way relationship from Circuits and Features to Superposition and Universality.
* Light green arrows indicate a one-way relationship from Features to SAEs and Probing.
* Light purple arrow indicates a one-way relationship from Circuits to Logit Lens.
### Detailed Analysis or ### Content Details
* **Hypothesis:**
* Superposition: Located in the top-left, connected to "Features" by a black arrow pointing from "Superposition" to "Features".
* Universality: Located below "Superposition", connected to "Circuits" by a black arrow pointing from "Universality" to "Circuits".
* **Fundamental Objects:**
* Features: Located in the center, connected to "Superposition" and "SAEs" and "Probing".
* Circuits: Located below "Features", connected to "Universality" and "Logit Lens".
* **Methods:**
* SAEs: Located in the top-right, connected to "Features" by a light green arrow pointing from "Features" to "SAEs".
* Probing: Located below "SAEs", connected to "Features" by a light green arrow pointing from "Features" to "Probing".
* Logit Lens: Located in the bottom-right, connected to "Circuits" by a light purple arrow pointing from "Circuits" to "Logit Lens". Also connected to "Features" by a light green arrow pointing from "Features" to "Logit Lens".
### Key Observations
* "Features" and "Circuits" are interconnected, suggesting a reciprocal relationship.
* "Superposition" is linked to "Features", while "Universality" is linked to "Circuits".
* "Features" are analyzed using "SAEs" and "Probing".
* "Circuits" are analyzed using "Logit Lens".
* "Logit Lens" is also connected to "Features".
### Interpretation
The diagram illustrates a conceptual framework for understanding how hypotheses (Superposition, Universality) relate to fundamental objects (Features, Circuits) and how these objects are analyzed using different methods (SAEs, Probing, Logit Lens). The interconnection between "Features" and "Circuits" suggests that they are interdependent. The diagram suggests that "SAEs" and "Probing" are used to analyze "Features", while "Logit Lens" is used to analyze "Circuits". The additional connection from "Features" to "Logit Lens" suggests that "Logit Lens" may also be used to analyze "Features" or that there is an indirect relationship between "Features" and "Circuits" that is captured by "Logit Lens".