## Conceptual Diagram: Hypotheses, Objects, and Methods in Interpretability Research
### Overview
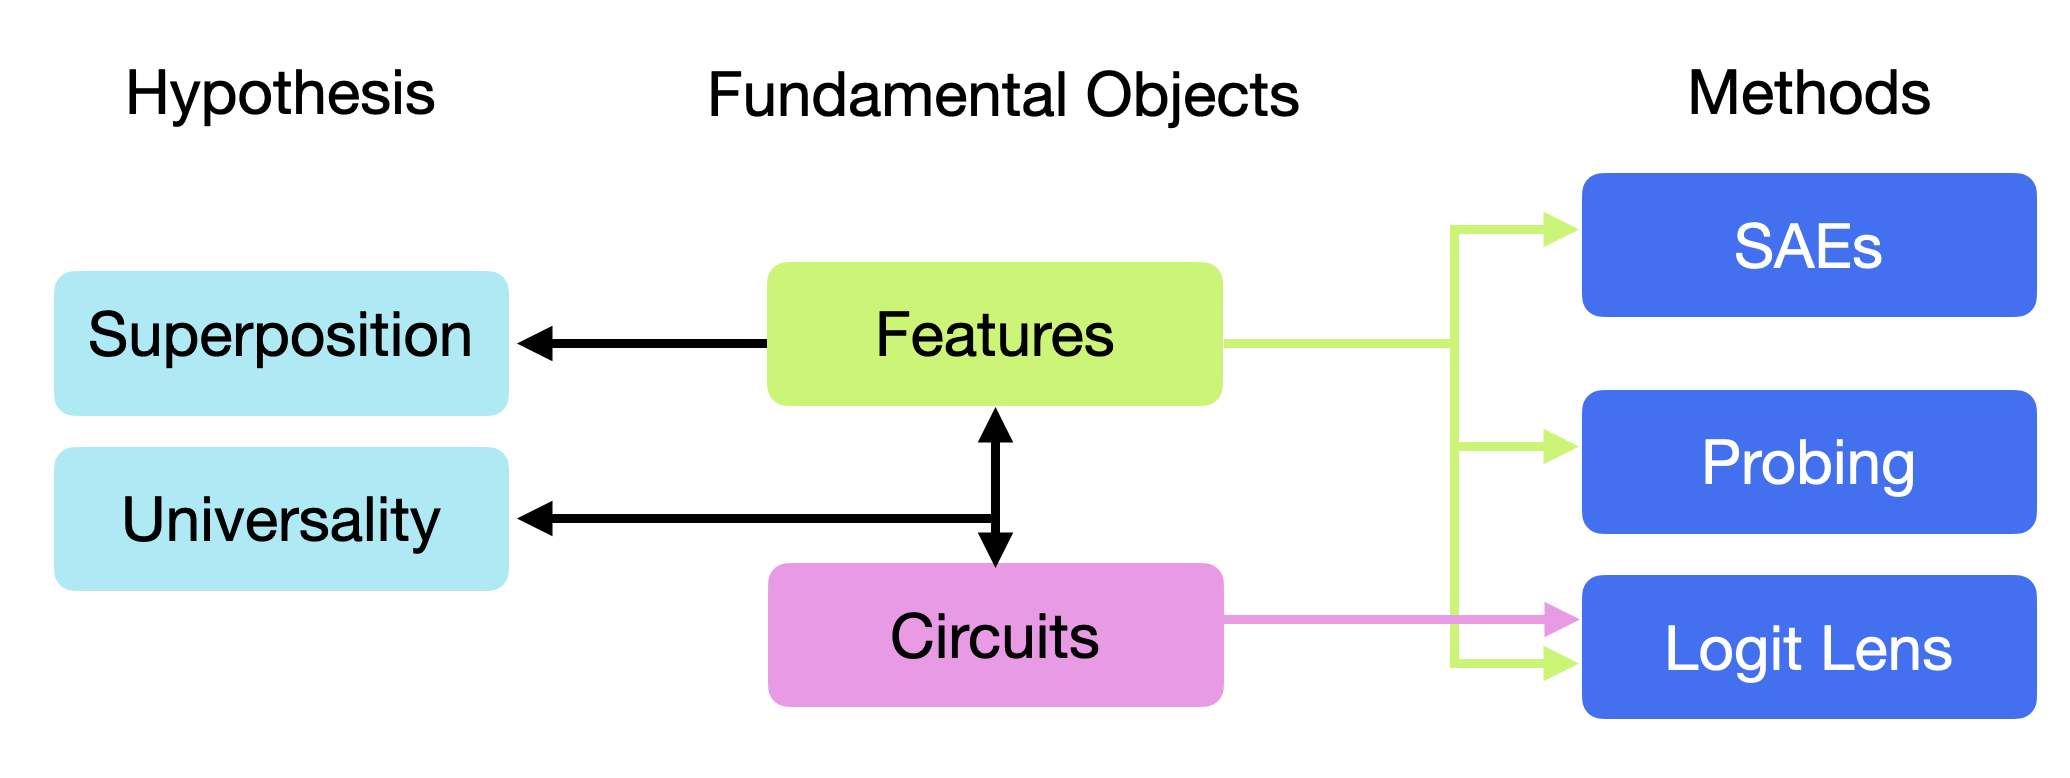
The image is a conceptual flow diagram illustrating the relationships between high-level hypotheses, fundamental objects of study, and specific analytical methods within a technical field, likely machine learning interpretability or neural network analysis. The diagram is organized into three distinct vertical columns.
### Components/Axes
The diagram is structured into three labeled columns from left to right:
1. **Hypothesis** (Left Column): Contains two light blue rectangular boxes.
2. **Fundamental Objects** (Center Column): Contains one green rectangular box and one pink rectangular box.
3. **Methods** (Right Column): Contains three blue rectangular boxes.
**Textual Elements and Their Positions:**
* **Column Headers:** "Hypothesis", "Fundamental Objects", "Methods" (centered at the top of their respective columns).
* **Hypothesis Boxes:**
* Top box: "Superposition"
* Bottom box: "Universality"
* **Fundamental Objects Boxes:**
* Top box: "Features" (green)
* Bottom box: "Circuits" (pink)
* **Methods Boxes:**
* Top box: "SAEs"
* Middle box: "Probing"
* Bottom box: "Logit Lens"
**Connections (Arrows):**
* A black arrow points from the "Features" box leftward to the "Superposition" box.
* A black arrow points from the "Features" box leftward to the "Universality" box.
* A black, double-headed vertical arrow connects the "Features" and "Circuits" boxes, indicating a bidirectional relationship.
* A light green arrow originates from the "Features" box and splits to point to all three Methods boxes ("SAEs", "Probing", "Logit Lens").
* A pink arrow originates from the "Circuits" box and points only to the "Logit Lens" method box.
### Detailed Analysis
The diagram maps a conceptual framework:
* **Hypotheses (Light Blue):** These are overarching theoretical concepts or phenomena being investigated: "Superposition" and "Universality".
* **Fundamental Objects (Green & Pink):** These are the core entities or constructs under study that relate to the hypotheses. "Features" is linked to both hypotheses. "Circuits" is linked only to the "Universality" hypothesis.
* **Methods (Blue):** These are the technical approaches used to study the fundamental objects. "Features" is studied using all three listed methods. "Circuits" is studied specifically using the "Logit Lens" method.
### Key Observations
1. **Central Role of "Features":** The "Features" object is the most connected node. It is linked to both hypotheses and is the subject of all three analytical methods.
2. **Specialized Link for "Circuits":** The "Circuits" object has a more specific role, connected only to the "Universality" hypothesis and analyzed solely via the "Logit Lens" method.
3. **Bidirectional Relationship:** The connection between "Features" and "Circuits" is bidirectional, suggesting they are interdependent or can be viewed as different levels of abstraction of the same underlying phenomenon.
4. **Method Specificity:** The diagram implies that while "Features" can be investigated with a broad toolkit (SAEs, Probing, Logit Lens), the study of "Circuits" relies on a more specialized technique (Logit Lens).
### Interpretation
This diagram outlines a research paradigm, likely for understanding the internal representations of neural networks. It proposes that high-level hypotheses about how networks function (e.g., that they represent many concepts in superposition, or that they learn universal features) are grounded in and tested through the study of concrete objects like "Features" (individual units or directions in activation space) and "Circuits" (networks of connected features).
The flow suggests a methodological pipeline: Researchers start with a hypothesis, identify the relevant fundamental object to study, and then apply specific methods to analyze that object. The centrality of "Features" indicates it is a primary unit of analysis in this field. The specialized link between "Circuits" and "Logit Lens" suggests that understanding circuit-level organization requires or is particularly suited to techniques that examine the model's output predictions (logits) through its internal layers. The diagram serves as a map for navigating the relationships between theory, objects of study, and practical tools in this technical domain.