## Bar Chart: Model Performance Metrics with/without Transformation
### Overview
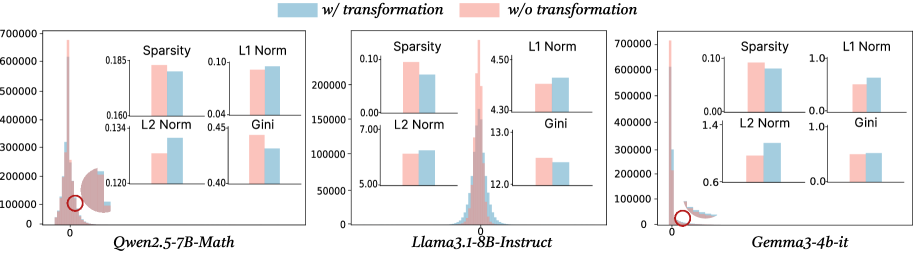
The image contains three grouped bar charts comparing performance metrics (Sparsity, L1 Norm, L2 Norm, Gini) across three AI models: **Qwen2.5-7B-Math**, **Llama3.1-8B-Instruct**, and **Gemma3-4b-it**. Each chart has two bars per metric: **blue** (with transformation) and **pink** (without transformation). Y-axis scales vary per subplot to accommodate metric ranges.
---
### Components/Axes
- **X-axis**: Model names (Qwen2.5-7B-Math, Llama3.1-8B-Instruct, Gemma3-4b-it)
- **Y-axis**:
- **Sparsity**: 0.00–0.70 (Qwen), 0.00–0.10 (Llama), 0.00–0.10 (Gemma)
- **L1 Norm**: 0.00–7.00 (Qwen), 0.00–5.00 (Llama), 0.00–1.00 (Gemma)
- **L2 Norm**: 0.00–15.00 (Qwen), 0.00–15.00 (Llama), 0.00–1.40 (Gemma)
- **Gini**: 0.00–0.20 (Qwen), 0.00–15.00 (Llama), 0.00–1.00 (Gemma)
- **Legend**:
- **Blue**: "with transformation"
- **Pink**: "without transformation"
---
### Detailed Analysis
#### Qwen2.5-7B-Math
- **Sparsity**: Pink (0.185) > Blue (0.160)
- **L1 Norm**: Pink (0.134) > Blue (0.120)
- **L2 Norm**: Pink (0.45) > Blue (0.40)
- **Gini**: Pink (0.120) < Blue (0.160)
#### Llama3.1-8B-Instruct
- **Sparsity**: Pink (0.10) > Blue (0.07)
- **L1 Norm**: Pink (4.5) > Blue (4.3)
- **L2 Norm**: Pink (13.0) > Blue (12.0)
- **Gini**: Pink (7.0) > Blue (5.0)
#### Gemma3-4b-it
- **Sparsity**: Pink (0.10) > Blue (0.08)
- **L1 Norm**: Pink (1.0) > Blue (0.8)
- **L2 Norm**: Pink (1.4) > Blue (0.6)
- **Gini**: Pink (1.0) > Blue (0.6)
---
### Key Observations
1. **Sparsity**: All models show lower sparsity with transformation (blue bars).
2. **L1/L2 Norms**: Transformation reduces these metrics across models, suggesting improved efficiency.
3. **Gini**: Mixed results:
- **Qwen**: Transformation increases Gini (0.120 → 0.160), indicating higher inequality.
- **Llama/Gemma**: Transformation decreases Gini (7.0 → 5.0; 1.0 → 0.6), suggesting reduced inequality.
4. **Outliers**:
- Llama’s L2 Norm (13.0) and Gini (7.0) are significantly higher than other models, even with transformation.
- Gemma’s L2 Norm (1.4) is notably higher than Qwen’s (0.45) despite similar model sizes.
---
### Interpretation
- **Transformation Impact**:
- Reduces computational metrics (Sparsity, L1/L2 Norms) across models, implying optimization benefits.
- Effects on inequality (Gini) are model-dependent:
- Qwen’s Gini increase suggests transformation may exacerbate output variability.
- Llama/Gemma’s Gini decrease indicates more equitable performance post-transformation.
- **Model Differences**:
- Llama3.1-8B-Instruct exhibits the highest L2 Norm and Gini values, suggesting inherent inefficiency or inequality in its architecture.
- Gemma3-4b-it balances lower L2 Norm (0.6) and Gini (0.6) with transformation, outperforming Qwen in inequality metrics.
- **Anomalies**:
- Qwen’s Gini increase with transformation contradicts trends in other models, warranting further investigation into its transformation pipeline.
This analysis highlights the nuanced trade-offs between efficiency and fairness when applying transformations to AI models.