\n
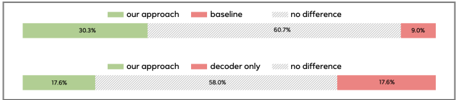
## Stacked Bar Chart: Performance Comparison
### Overview
The image presents a stacked bar chart comparing the performance of "our approach" against two baselines: "baseline" and "decoder only". The chart consists of two rows, each representing a different comparison scenario. The performance is quantified as a percentage.
### Components/Axes
* **Legend:** Located at the top-left and bottom-left corners, the legend defines the color coding:
* Green: "our approach"
* Light Gray: "baseline" / "decoder only"
* Red: "no difference"
* **Rows:** Two horizontal rows, each representing a comparison.
* **Stacked Bars:** Each row contains a stacked bar representing 100% total performance. The segments within each bar represent the percentage contribution of each category (our approach, baseline/decoder only, no difference).
* **Percentage Labels:** Numerical values are displayed within each segment of the stacked bars, indicating the percentage contribution.
### Detailed Analysis
**Row 1: "our approach" vs. "baseline"**
* "our approach" segment (Green): Approximately 30%. The bar starts at the left edge and extends about one-third of the total length.
* "baseline" segment (Light Gray): Approximately 60%. This segment occupies the middle portion of the bar, extending from the end of the "our approach" segment to near the end of the bar.
* "no difference" segment (Red): Approximately 10%. This segment is at the right end of the bar, representing the remaining 10%.
**Row 2: "our approach" vs. "decoder only"**
* "our approach" segment (Green): Approximately 17.6%. The bar starts at the left edge and extends about one-sixth of the total length.
* "decoder only" segment (Light Gray): Approximately 50.0%. This segment occupies the middle portion of the bar, extending from the end of the "our approach" segment to the middle of the bar.
* "no difference" segment (Red): Approximately 17.6%. This segment is at the right end of the bar, representing the remaining 17.6%.
### Key Observations
* In the first comparison ("our approach" vs. "baseline"), the "baseline" performs significantly better than "our approach" (60% vs. 30%).
* In the second comparison ("our approach" vs. "decoder only"), the "decoder only" performs better than "our approach" (50% vs. 17.6%).
* The "no difference" category is relatively small in both comparisons (10% and 17.6%).
### Interpretation
The data suggests that "our approach" does not outperform either the "baseline" or the "decoder only" method in the scenarios tested. In fact, it performs considerably worse in both cases. The "baseline" shows a substantial advantage over "our approach" in the first comparison, while the "decoder only" method also demonstrates superior performance in the second comparison. The relatively small "no difference" segments indicate that there are limited scenarios where the performance is comparable.
The chart implies that "our approach" may not be a viable alternative to the existing methods ("baseline" and "decoder only") based on the measured performance metric. Further investigation is needed to understand the reasons for the performance gap and to identify potential improvements for "our approach". The data does not provide information about the nature of the task or the specific performance metric being used, which limits the depth of the interpretation.