## Horizontal Bar Chart: Comparison of Approaches
### Overview
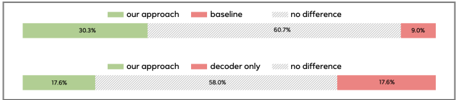
The image contains two horizontal bar charts comparing the performance of different approaches ("our approach," "baseline," "decoder only") against a "no difference" category. The charts use color-coded bars (green, red, gray) to represent proportions of outcomes, with percentages labeled on the bars.
### Components/Axes
- **Legend**: Located on the right side of the chart.
- **Green**: "our approach"
- **Red**: "baseline"
- **Gray**: "no difference"
- **Y-Axis**: Categories (e.g., "our approach," "baseline," "decoder only," "no difference").
- **X-Axis**: Labeled "percentage," representing the proportion of outcomes.
### Detailed Analysis
#### Top Chart: "Our Approach" vs. "Baseline"
- **Our Approach (Green)**: 30.3%
- **Baseline (Red)**: 60.7%
- **No Difference (Gray)**: 9.0%
#### Bottom Chart: "Our Approach," "Decoder Only," and "No Difference"
- **Our Approach (Green)**: 17.6%
- **Decoder Only (Red)**: 58.0%
- **No Difference (Gray)**: 17.6%
### Key Observations
1. In the top chart, the "baseline" approach dominates with 60.7%, while "our approach" accounts for 30.3%, and "no difference" is minimal (9.0%).
2. In the bottom chart, "decoder only" is the largest category (58.0%), with "our approach" and "no difference" tied at 17.6%.
3. The "no difference" category is consistently smaller in both charts, suggesting most outcomes are distinguishable between approaches.
### Interpretation
- The data highlights that "our approach" performs better than the baseline in the top chart but is less dominant than the "decoder only" approach in the bottom chart. This could indicate that the baseline is a strong default, while the "decoder only" method excels in specific scenarios.
- The near-equal split between "our approach" and "no difference" in the bottom chart suggests that the additional components of "our approach" (beyond the decoder) may not always provide a significant advantage.
- The "no difference" category’s low percentage in both charts implies that most outcomes are clearly attributable to one of the tested approaches, reducing ambiguity in comparisons.