## Line Chart: Time Needed for Reliable Agents
### Overview
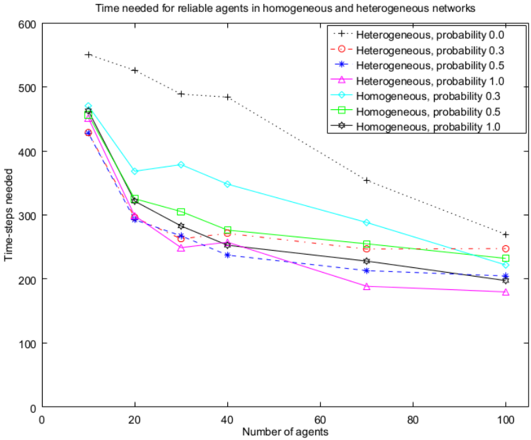
The image is a line chart comparing the time-steps needed for reliable agents in homogeneous and heterogeneous networks, varying by probability. The x-axis represents the number of agents, and the y-axis represents the time-steps needed. There are six data series, each representing a different network type and probability.
### Components/Axes
* **Title:** Time needed for reliable agents in homogeneous and heterogeneous networks
* **X-axis:** Number of agents
* Scale: 0 to 100, with tick marks at 0, 20, 40, 60, and 80, and 100.
* **Y-axis:** Time-steps needed
* Scale: 0 to 600, with no explicit tick marks shown, but the range is implied.
* **Legend:** Located in the top-right corner of the chart.
* `+`: Heterogeneous, probability 0.0
* `o`: Heterogeneous, probability 0.3
* `*`: Heterogeneous, probability 0.5
* `^`: Heterogeneous, probability 1.0
* `diamond`: Homogeneous, probability 0.3
* `square`: Homogeneous, probability 0.5
* `hexagon`: Homogeneous, probability 1.0
### Detailed Analysis
* **Heterogeneous, probability 0.0 (Black dotted line with + markers):**
* Trend: Decreasing, but plateaus after an initial drop.
* Data Points: Approximately (10, 560), (20, 490), (40, 490), (60, 480), (80, 370), (100, 250).
* **Heterogeneous, probability 0.3 (Red dashed line with circle markers):**
* Trend: Decreasing.
* Data Points: Approximately (10, 430), (20, 320), (40, 270), (60, 260), (80, 240), (100, 230).
* **Heterogeneous, probability 0.5 (Blue dashed line with star markers):**
* Trend: Decreasing.
* Data Points: Approximately (10, 440), (20, 300), (40, 240), (60, 230), (80, 210), (100, 200).
* **Heterogeneous, probability 1.0 (Magenta dashed line with triangle markers):**
* Trend: Decreasing.
* Data Points: Approximately (10, 460), (20, 290), (40, 200), (60, 190), (80, 190), (100, 200).
* **Homogeneous, probability 0.3 (Cyan solid line with diamond markers):**
* Trend: Decreasing initially, then increasing slightly, then decreasing again.
* Data Points: Approximately (10, 470), (20, 380), (40, 390), (60, 320), (80, 280), (100, 250).
* **Homogeneous, probability 0.5 (Green solid line with square markers):**
* Trend: Decreasing.
* Data Points: Approximately (10, 460), (20, 330), (40, 280), (60, 280), (80, 260), (100, 240).
* **Homogeneous, probability 1.0 (Black solid line with hexagon markers):**
* Trend: Decreasing.
* Data Points: Approximately (10, 430), (20, 320), (40, 270), (60, 250), (80, 230), (100, 220).
### Key Observations
* All lines generally decrease as the number of agents increases, indicating that more agents lead to fewer time-steps needed for reliable agents.
* The "Heterogeneous, probability 0.0" series (black dotted line) consistently requires the most time-steps.
* The "Heterogeneous, probability 1.0" series (magenta dashed line) consistently requires the fewest time-steps after 40 agents.
* The homogeneous networks generally perform better (require fewer time-steps) than the heterogeneous networks, especially at higher agent counts.
### Interpretation
The chart suggests that increasing the number of agents in both homogeneous and heterogeneous networks generally reduces the time-steps needed for reliable agents. However, the type of network and the probability significantly impact the performance. Heterogeneous networks with a probability of 0.0 require the most time-steps, indicating that this configuration is the least efficient. Conversely, heterogeneous networks with a probability of 1.0 become the most efficient as the number of agents increases. Homogeneous networks generally outperform heterogeneous networks, suggesting that uniformity in the network structure contributes to faster convergence to reliable agents. The initial drop in time-steps needed as the number of agents increases from 10 to 20 is significant across all configurations, indicating that even a small increase in the number of agents can have a substantial impact on performance.