## Line Chart: Time needed for reliable agents in homogeneous and heterogeneous networks
### Overview
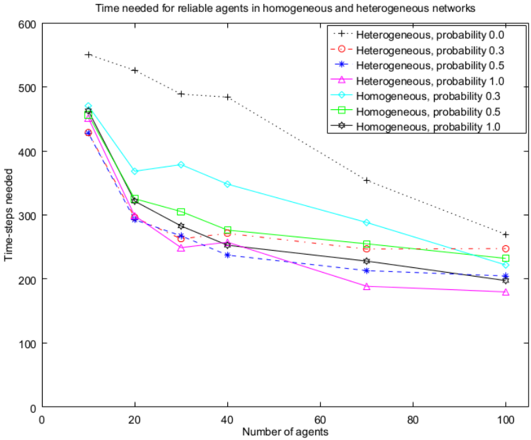
This line chart depicts the relationship between the number of agents and the time-steps needed for reliable agents in both homogeneous and heterogeneous networks, varying by probability. The chart aims to illustrate how network type and probability influence the time required to establish reliable agents as the number of agents increases.
### Components/Axes
* **Title:** "Time needed for reliable agents in homogeneous and heterogeneous networks" (Top-center)
* **X-axis:** "Number of agents" (Bottom-center), ranging from 0 to 100, with markers at 0, 20, 40, 60, 80, and 100.
* **Y-axis:** "Time-steps needed" (Left-center), ranging from 0 to 600, with markers at 0, 100, 200, 300, 400, 500, and 600.
* **Legend:** Located in the top-right corner, listing the following data series:
* Heterogeneous, probability 0.0 (Black '+')
* Heterogeneous, probability 0.3 (Red 'o')
* Heterogeneous, probability 0.6 (Blue '^')
* Heterogeneous, probability 1.0 (Green '<')
* Homogeneous, probability 0.3 (Cyan 's')
* Homogeneous, probability 0.5 (Magenta 'H')
* Homogeneous, probability 1.0 (Black 'x')
### Detailed Analysis
Here's a breakdown of each data series, with approximate values extracted from the chart:
* **Heterogeneous, probability 0.0 (Black '+'):** The line starts at approximately 470 time-steps at 0 agents, decreases to around 320 at 20 agents, then plateaus around 300-350 time-steps for the remainder of the agent range.
* **Heterogeneous, probability 0.3 (Red 'o'):** The line begins at approximately 440 time-steps at 0 agents, decreases to around 270 at 20 agents, continues to decrease to approximately 230 at 60 agents, and stabilizes around 220-240 time-steps.
* **Heterogeneous, probability 0.6 (Blue '^'):** Starts at approximately 380 time-steps at 0 agents, rapidly decreases to around 240 at 20 agents, then continues to decrease to approximately 190 at 60 agents, and stabilizes around 180-200 time-steps.
* **Heterogeneous, probability 1.0 (Green '<'):** Begins at approximately 330 time-steps at 0 agents, decreases to around 220 at 20 agents, continues to decrease to approximately 170 at 60 agents, and stabilizes around 160-180 time-steps.
* **Homogeneous, probability 0.3 (Cyan 's'):** Starts at approximately 410 time-steps at 0 agents, decreases to around 340 at 20 agents, then fluctuates between 300 and 360 time-steps for the remainder of the agent range.
* **Homogeneous, probability 0.5 (Magenta 'H'):** Begins at approximately 300 time-steps at 0 agents, decreases to around 230 at 20 agents, then continues to decrease to approximately 180 at 60 agents, and stabilizes around 170-190 time-steps.
* **Homogeneous, probability 1.0 (Black 'x'):** Starts at approximately 530 time-steps at 0 agents, decreases to around 400 at 20 agents, then gradually decreases to approximately 270 at 80 agents, and stabilizes around 260-280 time-steps.
### Key Observations
* Generally, all lines exhibit a decreasing trend, indicating that as the number of agents increases, the time-steps needed for reliable agents decreases.
* Heterogeneous networks with higher probabilities (0.6 and 1.0) consistently require fewer time-steps than those with lower probabilities (0.0 and 0.3).
* Homogeneous networks with probability 1.0 consistently require the most time-steps.
* The rate of decrease in time-steps is most pronounced in the initial stages (0-20 agents) for most series.
* The lines tend to flatten out after approximately 60 agents, suggesting diminishing returns in terms of time reduction with increasing agent numbers.
### Interpretation
The data suggests that heterogeneous networks are more efficient at establishing reliable agents than homogeneous networks, particularly as the number of agents increases. This efficiency is further enhanced by increasing the probability within the heterogeneous network. The initial steep decline in time-steps across all series indicates a rapid improvement in reliability with the addition of the first few agents. The flattening of the curves at higher agent numbers suggests that beyond a certain point, adding more agents yields only marginal improvements in reliability.
The outlier is the Homogeneous network with probability 1.0, which consistently requires the most time-steps. This could indicate that a fully homogeneous network with a high probability setting is less adaptable or requires more coordination to achieve reliability.
The relationships between network type (homogeneous vs. heterogeneous) and probability are crucial. The data demonstrates that heterogeneity, combined with a higher probability, leads to faster establishment of reliable agents. This could be due to the increased diversity and adaptability of heterogeneous networks, allowing them to overcome challenges more effectively. The probability likely represents the likelihood of successful interactions or connections between agents, and a higher probability facilitates quicker reliability.