TECHNICAL ASSET FINGERPRINT
0ed9a9e369d280cc08e239f7
Click to view fullscreen
Press ESC or click to close
FOUND IN PAPERS
EXPERT: healer-alpha-free VERSION 1
RUNTIME: free/openrouter/healer-alpha
INTEL_VERIFIED
\n
## Line Chart: Time needed for reliable agents in homogeneous and heterogeneous networks
### Overview
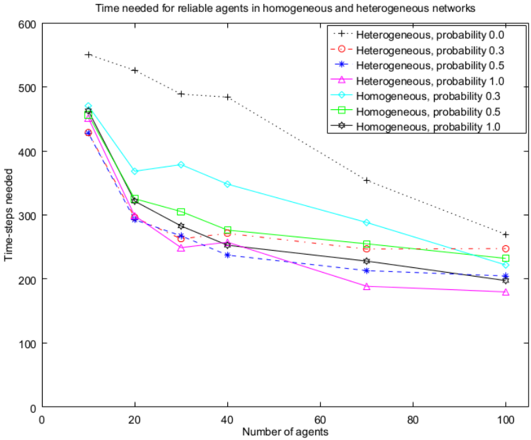
The image is a line chart comparing the performance (in time-steps needed) of agent-based systems across two network types (Homogeneous and Heterogeneous) and four different probability values (0.0, 0.3, 0.5, 1.0). The chart plots "Time-steps needed" against the "Number of agents," showing how the required time decreases as the number of agents increases for all configurations.
### Components/Axes
* **Chart Title:** "Time needed for reliable agents in homogeneous and heterogeneous networks"
* **X-Axis:**
* **Label:** "Number of agents"
* **Scale:** Linear, from 0 to 100.
* **Major Tick Marks:** 0, 20, 40, 60, 80, 100.
* **Y-Axis:**
* **Label:** "Time-steps needed"
* **Scale:** Linear, from 0 to 600.
* **Major Tick Marks:** 0, 100, 200, 300, 400, 500, 600.
* **Legend:** Located in the top-right corner of the plot area. It defines 7 data series with unique combinations of line color, marker style, and line style.
1. **Heterogeneous, probability 0.0:** Black plus sign (`+`) marker, black dotted line.
2. **Heterogeneous, probability 0.3:** Red circle (`o`) marker, red dashed line.
3. **Heterogeneous, probability 0.5:** Blue asterisk (`*`) marker, blue dashed line.
4. **Heterogeneous, probability 1.0:** Magenta upward-pointing triangle (`^`) marker, magenta solid line.
5. **Homogeneous, probability 0.3:** Cyan diamond (`d`) marker, cyan solid line.
6. **Homogeneous, probability 0.5:** Green square (`s`) marker, green solid line.
7. **Homogeneous, probability 1.0:** Black left-pointing triangle (`<`) marker, black solid line.
### Detailed Analysis
The chart displays data for 7 distinct series. All series show a downward trend, indicating that increasing the number of agents reduces the time-steps needed for reliability. The data points are plotted at agent counts of approximately 10, 20, 30, 40, 70, and 100.
**Trend Verification & Data Points (Approximate):**
* **Heterogeneous, probability 0.0 (Black, Dotted, `+`):** This series has the highest time-steps across all agent counts. It starts at ~550 time-steps for 10 agents and declines to ~270 for 100 agents. The slope is less steep than other series.
* **Heterogeneous, probability 0.3 (Red, Dashed, `o`):** Starts at ~460 (10 agents), drops to ~300 (20 agents), and ends at ~250 (100 agents).
* **Heterogeneous, probability 0.5 (Blue, Dashed, `*`):** Starts at ~430 (10 agents), drops to ~295 (20 agents), and ends at ~200 (100 agents).
* **Heterogeneous, probability 1.0 (Magenta, Solid, `^`):** This is the lowest-performing series overall. Starts at ~430 (10 agents), drops to ~295 (20 agents), and ends at ~180 (100 agents).
* **Homogeneous, probability 0.3 (Cyan, Solid, `d`):** Starts at ~470 (10 agents), drops to ~370 (20 agents), and ends at ~230 (100 agents). It is consistently higher than its Heterogeneous counterpart (prob 0.3).
* **Homogeneous, probability 0.5 (Green, Solid, `s`):** Starts at ~460 (10 agents), drops to ~320 (20 agents), and ends at ~230 (100 agents). It is very close to the Homogeneous prob 0.3 line at higher agent counts.
* **Homogeneous, probability 1.0 (Black, Solid, `<`):** Starts at ~460 (10 agents), drops to ~320 (20 agents), and ends at ~200 (100 agents). It closely follows the Heterogeneous prob 0.5 line.
**Spatial Grounding & Cross-Reference:**
* The **black dotted line with `+` markers** (Heterogeneous, prob 0.0) is visually isolated at the top of the chart.
* The **magenta solid line with `^` markers** (Heterogeneous, prob 1.0) is the lowest line for most of the x-axis range.
* The **cyan solid line with `d` markers** (Homogeneous, prob 0.3) is the highest among the "Homogeneous" series.
* At 100 agents, the lines converge into two loose clusters: a higher cluster around 230-270 time-steps (Heterogeneous prob 0.0 & 0.3, Homogeneous prob 0.3 & 0.5) and a lower cluster around 180-200 time-steps (Heterogeneous prob 0.5 & 1.0, Homogeneous prob 1.0).
### Key Observations
1. **Universal Negative Correlation:** For all network types and probabilities, the time-steps needed decrease as the number of agents increases.
2. **Impact of Probability:** Higher probability values (0.5, 1.0) generally lead to lower time-steps than lower probabilities (0.0, 0.3) within the same network type.
3. **Network Type Comparison:** At the same probability level, **Heterogeneous networks consistently outperform (require fewer time-steps than) Homogeneous networks**. This is most evident when comparing the red dashed line (Heterogeneous, 0.3) to the cyan solid line (Homogeneous, 0.3).
4. **Outlier Series:** The "Heterogeneous, probability 0.0" series is a clear outlier, requiring significantly more time-steps than all other configurations, especially at lower agent counts.
5. **Diminishing Returns:** The rate of improvement (reduction in time-steps) slows as the number of agents increases, suggesting diminishing returns beyond a certain point (e.g., after 40-60 agents).
### Interpretation
This chart demonstrates the efficiency gains from parallelization (adding more agents) in achieving reliable outcomes within networked systems. The data suggests two key principles:
1. **Heterogeneity is Beneficial:** Under identical reliability probability constraints, heterogeneous networks (where agents may have different roles, capabilities, or connections) achieve reliability faster than homogeneous networks. This implies that diversity in agent function or network structure can be a significant efficiency advantage.
2. **Reliability Probability is a Critical Lever:** The "probability" parameter (likely representing the probability of an agent performing its task correctly or a communication link succeeding) has a profound impact. Systems designed with higher inherent reliability (probability 1.0) require far fewer agents and less time to reach a reliable state. The poor performance of the 0.0 probability case highlights the catastrophic impact of complete unreliability in a component of the system.
The convergence of lines at higher agent counts indicates that with sufficient parallel resources, the disadvantages of lower probability or homogeneous design can be partially mitigated, but not eliminated. The chart provides a quantitative basis for making design trade-offs between investing in more reliable components (higher probability), designing more diverse systems (heterogeneity), or simply scaling up the number of agents.
DECODING INTELLIGENCE...