# Technical Document Extraction: Performance Comparison of QA Models
## 1. Image Overview
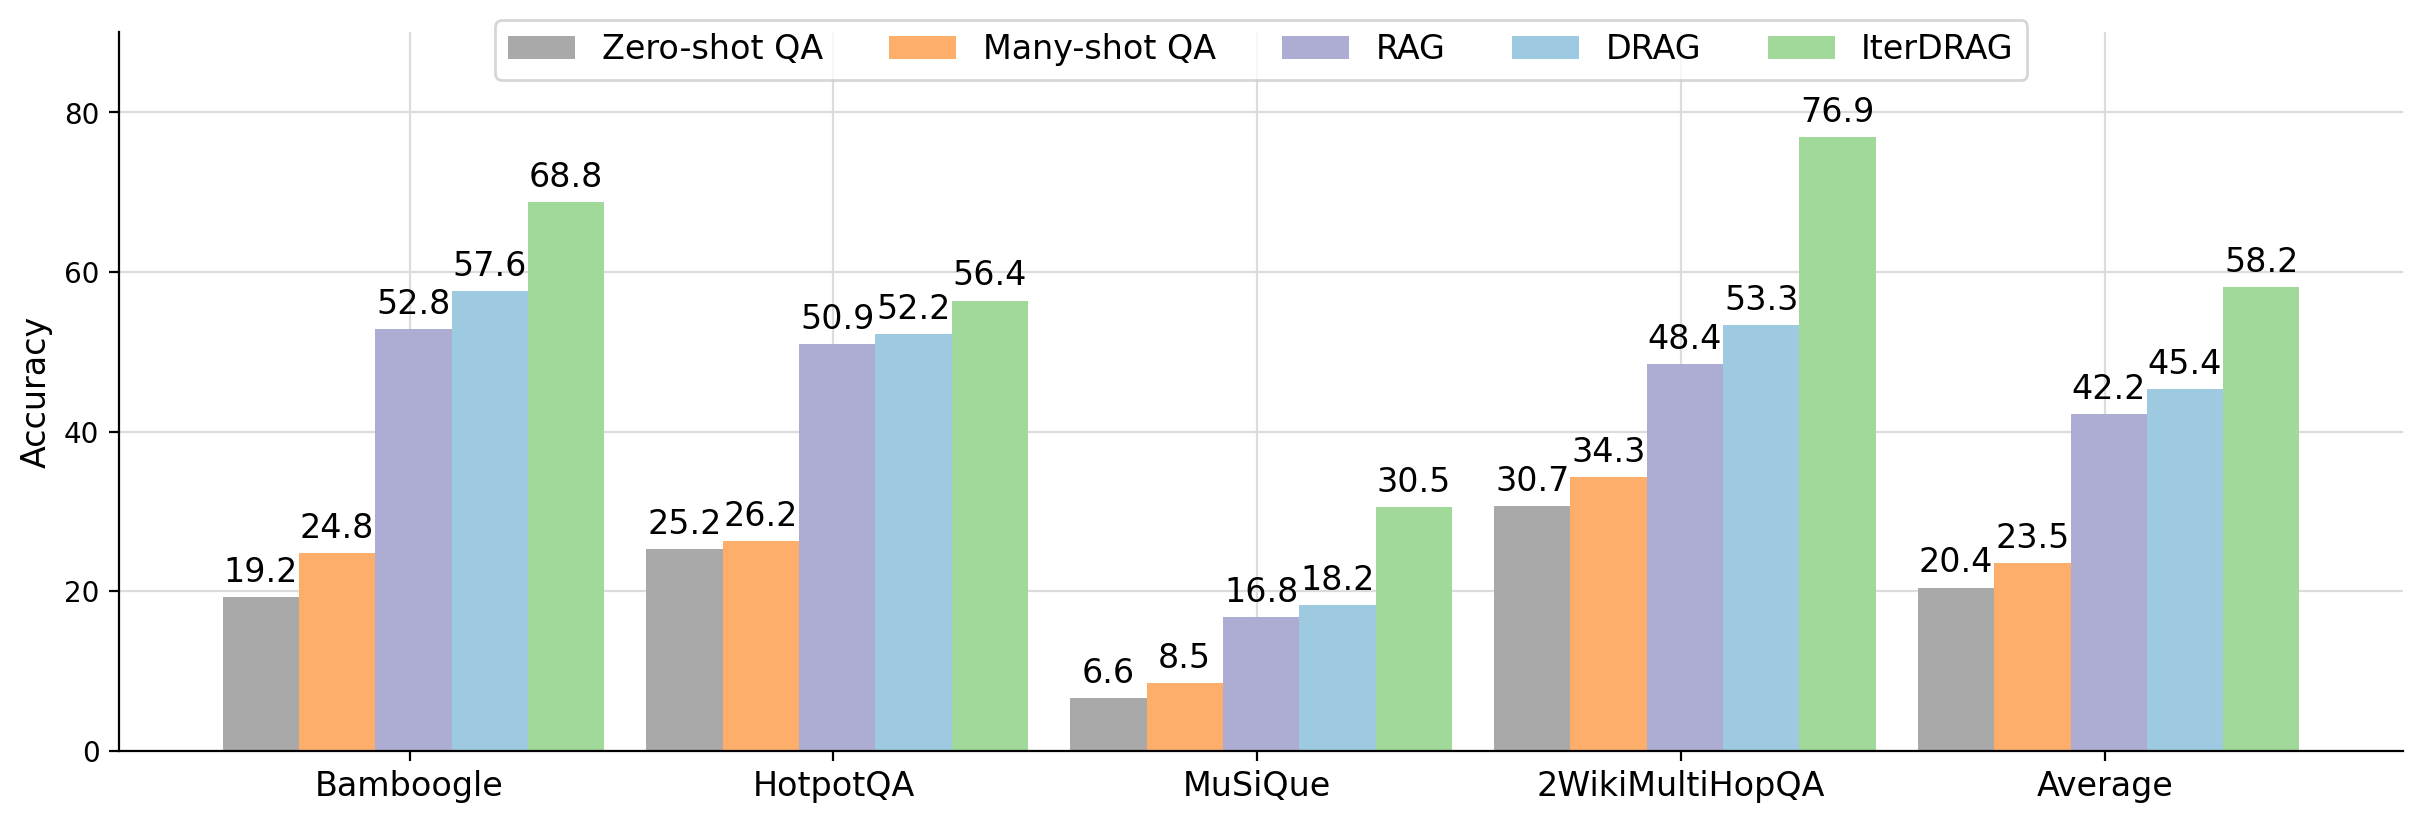
This image is a grouped bar chart comparing the performance (Accuracy) of five different Question Answering (QA) methodologies across four specific datasets and an overall average. The chart uses a color-coded system to differentiate between the models.
## 2. Component Isolation
### A. Header / Legend
* **Location:** Top-center of the chart area.
* **Legend Items (Left to Right):**
* **Zero-shot QA:** Dark Gray bar
* **Many-shot QA:** Orange bar
* **RAG:** Light Purple bar
* **DRAG:** Light Blue bar
* **IterDRAG:** Light Green bar
### B. Main Chart Area (Axes)
* **Y-Axis (Vertical):** Labeled **"Accuracy"**. Scale ranges from 0 to 80, with major gridlines and markers at intervals of 20 (0, 20, 40, 60, 80).
* **X-Axis (Horizontal):** Categorical axis representing datasets and the summary metric.
* **Categories:** Bamboogle, HotpotQA, MuSiQue, 2WikiMultiHopQA, Average.
* **Grid:** Light gray horizontal and vertical gridlines are present to facilitate value estimation.
### C. Data Visualization
The chart consists of five groups of bars. Each group contains five bars corresponding to the models in the legend. Numerical values are printed directly above each bar for precision.
---
## 3. Data Table Reconstruction
The following table transcribes all numerical data points presented in the chart.
| Dataset / Category | Zero-shot QA (Gray) | Many-shot QA (Orange) | RAG (Purple) | DRAG (Blue) | IterDRAG (Green) |
| :--- | :---: | :---: | :---: | :---: | :---: |
| **Bamboogle** | 19.2 | 24.8 | 52.8 | 57.6 | 68.8 |
| **HotpotQA** | 25.2 | 26.2 | 50.9 | 52.2 | 56.4 |
| **MuSiQue** | 6.6 | 8.5 | 16.8 | 18.2 | 30.5 |
| **2WikiMultiHopQA** | 30.7 | 34.3 | 48.4 | 53.3 | 76.9 |
| **Average** | 20.4 | 23.5 | 42.2 | 45.4 | 58.2 |
---
## 4. Trend Analysis and Key Findings
### Trend Verification
For every category (Bamboogle, HotpotQA, MuSiQue, 2WikiMultiHopQA, and Average), the data series follows a consistent **upward slope**.
* **Zero-shot QA** is always the lowest performing.
* **Many-shot QA** shows a marginal improvement over Zero-shot.
* **RAG** shows a significant performance jump compared to Many-shot QA.
* **DRAG** consistently outperforms RAG.
* **IterDRAG** is consistently the highest-performing model across all datasets.
### Key Observations
1. **Superiority of IterDRAG:** IterDRAG achieves the highest accuracy in every single test case. Its most significant lead is in the **2WikiMultiHopQA** dataset, where it reaches **76.9%**, nearly 24 percentage points higher than the next best model (DRAG at 53.3%).
2. **Dataset Difficulty:** **MuSiQue** appears to be the most challenging dataset for all models, with the highest score (IterDRAG) only reaching **30.5%**, while other datasets see scores in the 50s, 60s, or 70s.
3. **RAG vs. Non-RAG:** There is a distinct "step-function" increase in accuracy when moving from Many-shot QA to RAG-based methods (RAG, DRAG, IterDRAG). For example, in Bamboogle, accuracy jumps from 24.8% (Many-shot) to 52.8% (RAG).
4. **Average Performance:** On average, IterDRAG (**58.2%**) outperforms the baseline Zero-shot QA (**20.4%**) by a factor of nearly 3x.