## Scatter Plots: Top 10 Safety Heads on Jailbreakbench and Malicious Instrct
### Overview
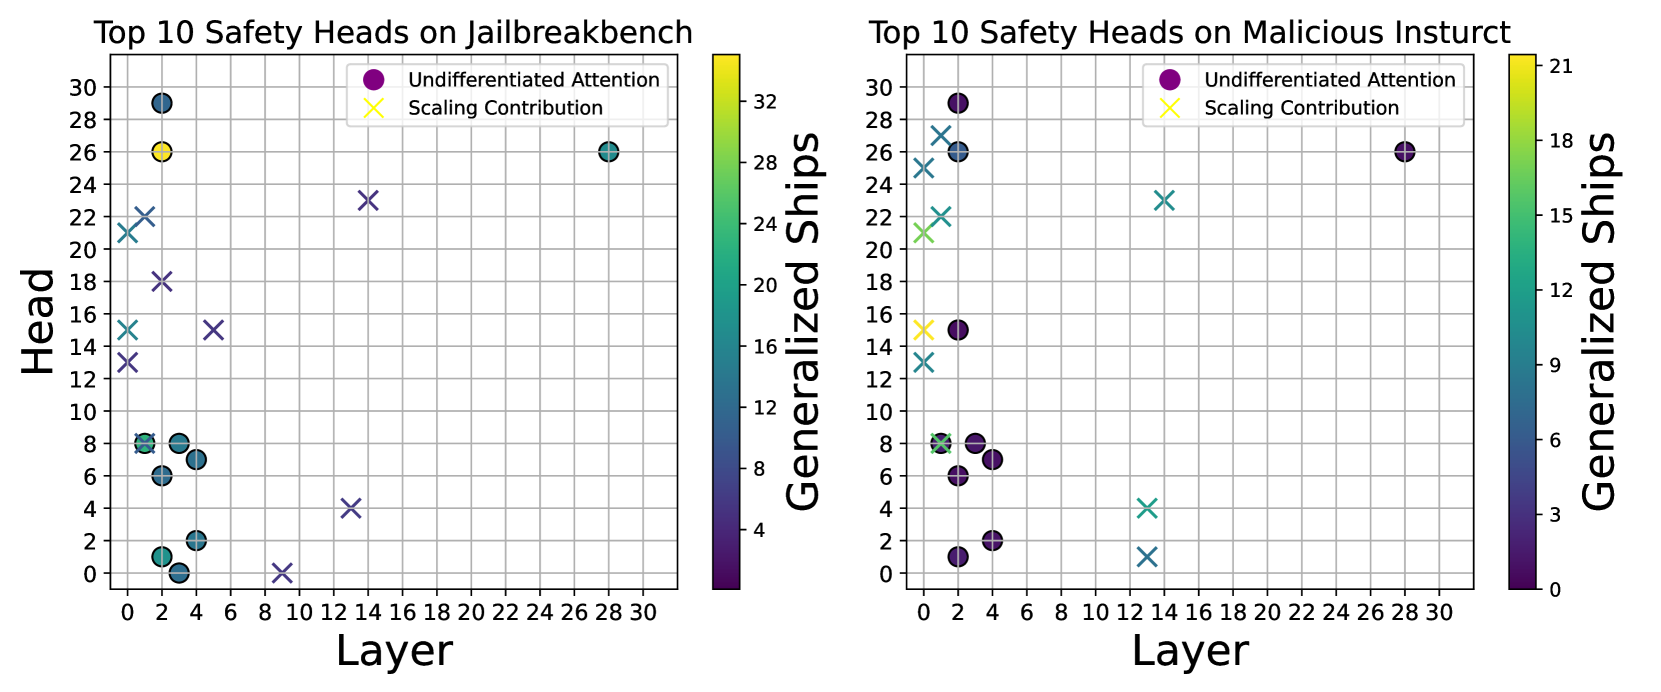
The image contains two side-by-side scatter plots comparing safety head metrics across layers for two datasets: "Jailbreakbench" (left) and "Malicious Instrct" (right). Each plot uses color-coded markers (purple circles for "Undifferentiated Attention" and yellow crosses for "Scaling Contribution") and a color scale for "Generalized Ships." The plots reveal spatial distributions of data points, with notable outliers and trends.
---
### Components/Axes
- **Left Plot (Jailbreakbench):**
- **X-axis (Layer):** 0 to 30 (integer increments).
- **Y-axis (Head):** 0 to 30 (integer increments).
- **Legend:** Top-right corner, with purple circles labeled "Undifferentiated Attention" and yellow crosses labeled "Scaling Contribution."
- **Color Scale:** Right side, labeled "Generalized Ships" (0–32), with a gradient from dark purple (low) to yellow (high).
- **Right Plot (Malicious Instrct):**
- **X-axis (Layer):** 0 to 30 (integer increments).
- **Y-axis (Head):** 0 to 28 (integer increments).
- **Legend:** Top-right corner, same labels as the left plot.
- **Color Scale:** Right side, labeled "Generalized Ships" (0–21), with a gradient from dark purple (low) to yellow (high).
---
### Detailed Analysis
#### Left Plot (Jailbreakbench)
- **Data Points:**
- **Highest Head Value:** 29 at Layer 3 (purple circle).
- **Notable Outlier:** Yellow cross at Layer 3, Head 26 (highest Scaling Contribution).
- **Trend:** Head values generally decrease as Layer increases, with a cluster of low Head values (0–8) at Layers 0–4.
- **Color Scale:** The yellow cross at Layer 3 has the highest Generalized Ships (32), while most points cluster in the 8–16 range.
- **Spatial Grounding:**
- Purple circles (Undifferentiated Attention) dominate the lower-left quadrant (Layers 0–10, Heads 0–10).
- Yellow crosses (Scaling Contribution) are scattered, with the highest value at Layer 3.
#### Right Plot (Malicious Instrct)
- **Data Points:**
- **Highest Head Value:** 29 at Layer 2 (purple circle).
- **Notable Outlier:** Yellow cross at Layer 14, Head 22 (highest Scaling Contribution).
- **Trend:** Head values decrease with Layer, but with a cluster of low Head values (0–8) at Layers 0–6.
- **Color Scale:** The yellow cross at Layer 14 has the highest Generalized Ships (21), while most points cluster in the 3–12 range.
- **Spatial Grounding:**
- Purple circles (Undifferentiated Attention) are concentrated in the lower-left quadrant (Layers 0–6, Heads 0–8).
- Yellow crosses (Scaling Contribution) are sparse, with the highest value at Layer 14.
---
### Key Observations
1. **Outliers:**
- Jailbreakbench: A yellow cross at Layer 3 (Head 26) stands out as the highest Scaling Contribution.
- Malicious Instrct: A yellow cross at Layer 14 (Head 22) is the highest Scaling Contribution.
2. **Trends:**
- Both plots show a general decline in Head values as Layer increases, but with exceptions (e.g., Layer 3 in Jailbreakbench, Layer 2 in Malicious Instrct).
- The color scale suggests that higher Generalized Ships correlate with specific layers (e.g., Layer 3 in Jailbreakbench, Layer 14 in Malicious Instrct).
3. **Legend Consistency:**
- Purple circles (Undifferentiated Attention) and yellow crosses (Scaling Contribution) are consistently mapped across both plots.
---
### Interpretation
- **Data Implications:**
- The "Undifferentiated Attention" (purple circles) dominates lower layers, suggesting a focus on foundational patterns in early layers.
- "Scaling Contribution" (yellow crosses) appears in specific layers, indicating targeted optimization for safety in those regions.
- The color scale (Generalized Ships) highlights layers where safety mechanisms are most generalized, with Jailbreakbench showing higher values (up to 32) compared to Malicious Instrct (up to 21).
- **Anomalies:**
- The yellow cross at Layer 3 (Jailbreakbench) and Layer 14 (Malicious Instrct) may represent critical layers where safety scaling is prioritized, despite lower Head values in surrounding layers.
- **Broader Context:**
- The plots likely reflect model architecture design choices, where certain layers are optimized for safety through attention mechanisms or scaling strategies. The disparity in Generalized Ships between datasets suggests differing safety requirements or model configurations.
---
### Final Notes
- **Language:** All text is in English. No non-English content is present.
- **Data Completeness:** All axis labels, legends, and color scales are explicitly described. No data tables or embedded text beyond the legends and axis titles are visible.
- **Uncertainty:** Approximate values are provided based on grid alignment (e.g., Head 29 at Layer 3 in Jailbreakbench). Exact numerical precision cannot be confirmed without raw data.