# Technical Document Extraction: Accuracy vs. Context Length
## Chart Description
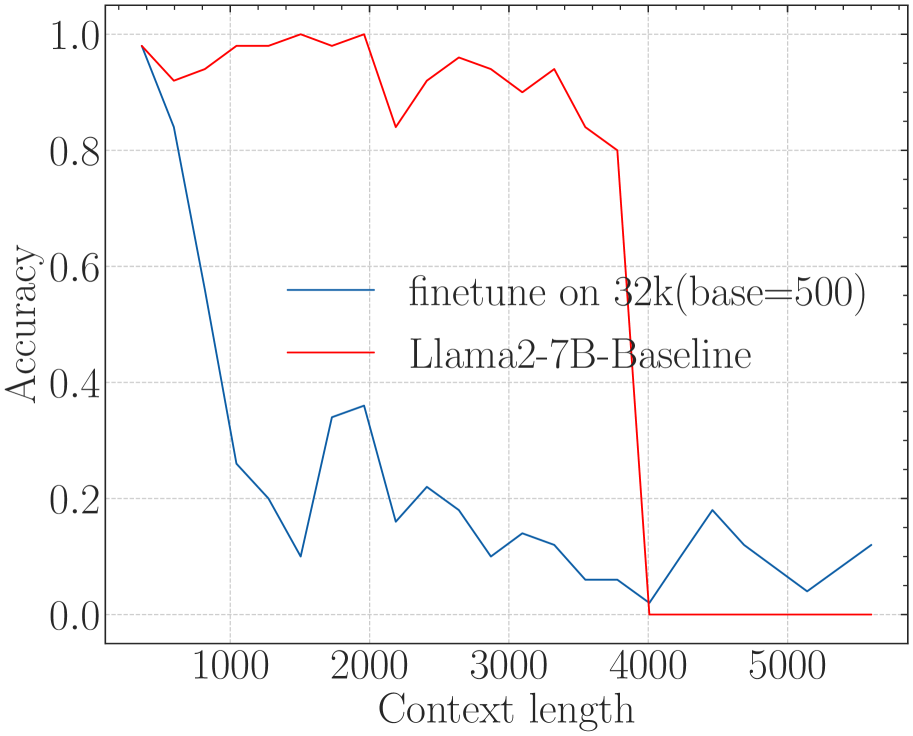
This image is a **line graph** comparing the accuracy of two language models across varying context lengths. The graph includes two data series, axis labels, a legend, and gridlines for reference.
---
### **Key Components**
1. **Axes**
- **X-axis (Horizontal)**:
- Label: `Context length`
- Range: `1000` to `5000` (in increments of 1000)
- Ticks: `1000`, `2000`, `3000`, `4000`, `5000`
- **Y-axis (Vertical)**:
- Label: `Accuracy`
- Range: `0.0` to `1.0` (in increments of 0.2)
- Ticks: `0.0`, `0.2`, `0.4`, `0.6`, `0.8`, `1.0`
2. **Legend**
- Located in the **upper right corner**.
- Entries:
- `finetune on 32k(base=500)` (blue line)
- `Llama2-7B-Baseline` (red line)
3. **Gridlines**
- Dashed gray lines span the plot area, aligning with axis ticks.
---
### **Data Series Analysis**
#### **1. `finetune on 32k(base=500)` (Blue Line)**
- **Trend**:
- Starts at **1.0 accuracy** at `context length = 1000`.
- Sharp decline to **~0.2 accuracy** by `context length = 2000`.
- Fluctuates between **0.1 and 0.3** for `context lengths = 3000` to `5000`.
- **Key Data Points**:
- `1000`: 1.0
- `2000`: ~0.2
- `3000`: ~0.15
- `4000`: ~0.05
- `5000`: ~0.15
#### **2. `Llama2-7B-Baseline` (Red Line)**
- **Trend**:
- Maintains **~1.0 accuracy** until `context length = 4000`.
- Abrupt drop to **0.0 accuracy** at `context length = 4000`.
- Remains at 0.0 for `context lengths = 4000` to `5000`.
- **Key Data Points**:
- `1000`: 1.0
- `2000`: 1.0
- `3000`: 1.0
- `4000`: 0.0
- `5000`: 0.0
---
### **Cross-Reference Verification**
- **Legend Colors**:
- Blue (`finetune`) matches the blue line.
- Red (`Llama2-7B-Baseline`) matches the red line.
- **Spatial Grounding**:
- Legend is positioned in the **upper right** (coordinates: `[x=0.8, y=0.9]` relative to the plot area).
---
### **Observations**
1. The `finetune on 32k(base=500)` model shows **significant performance degradation** as context length increases beyond 1000.
2. The `Llama2-7B-Baseline` model maintains high accuracy until `context length = 4000`, after which it fails completely.
3. Both models exhibit **non-linear behavior**, with sharp transitions at specific context lengths.
---
### **Conclusion**
The graph highlights a critical divergence in model performance: the `finetune` model degrades gradually, while the `Llama2-7B-Baseline` model fails catastrophically at `context length = 4000`. Further investigation is warranted to understand the root cause of the red line's abrupt collapse.