## Line Charts: Model Performance vs. Shuffle Ratio
### Overview
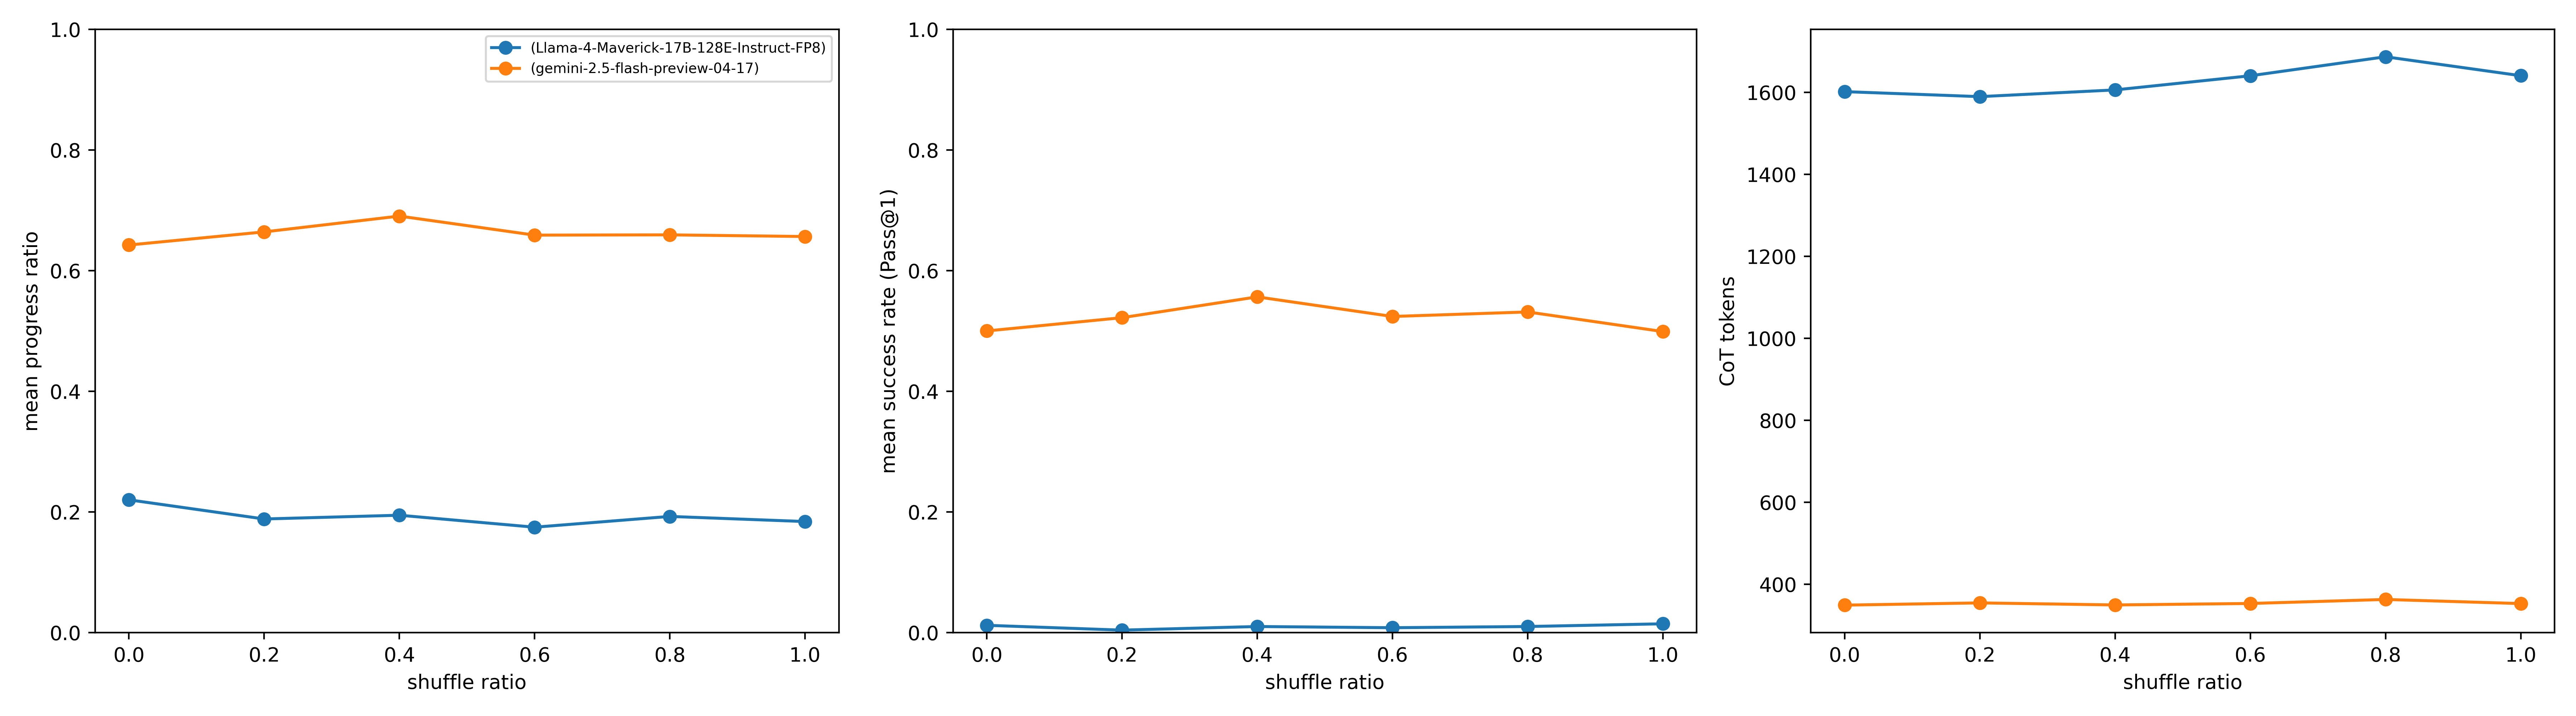
The image presents three line charts comparing the performance of two language models, "Llama-4-Maverick-17B-128E-Instruct-FP8" and "gemini-2.5-flash-preview-04-17", across varying "shuffle ratios". The charts depict "mean progress ratio", "mean success rate (Pass@1)", and "CoT tokens" as a function of the shuffle ratio.
### Components/Axes
**Legend:** Located at the top-center of the image, the legend identifies the two models:
* Blue: (Llama-4-Maverick-17B-128E-Instruct-FP8)
* Orange: (gemini-2.5-flash-preview-04-17)
**X-Axis (All Charts):**
* Label: "shuffle ratio"
* Scale: 0.0 to 1.0, with increments of 0.2 (0.0, 0.2, 0.4, 0.6, 0.8, 1.0)
**Y-Axis (Chart 1):**
* Label: "mean progress ratio"
* Scale: 0.0 to 1.0, with increments of 0.2 (0.0, 0.2, 0.4, 0.6, 0.8, 1.0)
**Y-Axis (Chart 2):**
* Label: "mean success rate (Pass@1)"
* Scale: 0.0 to 1.0, with increments of 0.2 (0.0, 0.2, 0.4, 0.6, 0.8, 1.0)
**Y-Axis (Chart 3):**
* Label: "CoT tokens"
* Scale: 400 to 1600, with increments of 200 (400, 600, 800, 1000, 1200, 1400, 1600)
### Detailed Analysis
**Chart 1: Mean Progress Ratio vs. Shuffle Ratio**
* **Llama-4 (Blue):** The line is relatively flat, hovering around a mean progress ratio of approximately 0.2.
* At shuffle ratio 0.0, the mean progress ratio is approximately 0.22.
* At shuffle ratio 1.0, the mean progress ratio is approximately 0.18.
* **Gemini-2.5 (Orange):** The line is relatively flat, hovering around a mean progress ratio of approximately 0.65 to 0.7.
* At shuffle ratio 0.0, the mean progress ratio is approximately 0.65.
* At shuffle ratio 0.4, the mean progress ratio is approximately 0.69.
* At shuffle ratio 1.0, the mean progress ratio is approximately 0.66.
**Chart 2: Mean Success Rate (Pass@1) vs. Shuffle Ratio**
* **Llama-4 (Blue):** The line is nearly flat at the bottom of the chart, indicating a very low mean success rate, close to 0.0.
* At shuffle ratio 0.0, the mean success rate is approximately 0.01.
* At shuffle ratio 1.0, the mean success rate is approximately 0.01.
* **Gemini-2.5 (Orange):** The line is relatively flat, hovering around a mean success rate of approximately 0.5 to 0.55.
* At shuffle ratio 0.0, the mean success rate is approximately 0.50.
* At shuffle ratio 0.4, the mean success rate is approximately 0.55.
* At shuffle ratio 1.0, the mean success rate is approximately 0.52.
**Chart 3: CoT Tokens vs. Shuffle Ratio**
* **Llama-4 (Blue):** The line is relatively flat, hovering around 1600 CoT tokens.
* At shuffle ratio 0.0, the CoT tokens are approximately 1600.
* At shuffle ratio 0.8, the CoT tokens are approximately 1650.
* At shuffle ratio 1.0, the CoT tokens are approximately 1620.
* **Gemini-2.5 (Orange):** The line is relatively flat, hovering around 400 CoT tokens.
* At shuffle ratio 0.0, the CoT tokens are approximately 350.
* At shuffle ratio 0.4, the CoT tokens are approximately 360.
* At shuffle ratio 1.0, the CoT tokens are approximately 360.
### Key Observations
* Across all shuffle ratios, Gemini-2.5 consistently outperforms Llama-4 in terms of mean progress ratio and mean success rate.
* Llama-4 consistently uses significantly more CoT tokens than Gemini-2.5.
* The shuffle ratio appears to have a minimal impact on the performance metrics for both models within the tested range (0.0 to 1.0).
### Interpretation
The data suggests that Gemini-2.5 is a more efficient and effective model than Llama-4 for the given task, as it achieves higher progress and success rates with significantly fewer CoT tokens. The relative insensitivity of both models to the shuffle ratio indicates that the models' performance is not significantly affected by the order of input data within the tested range. This could imply that the models have robust mechanisms for handling variations in input order or that the task itself is not highly sensitive to input order. The higher CoT token usage by Llama-4, despite its lower performance, could indicate a less efficient reasoning process or a tendency to generate more verbose explanations without necessarily improving accuracy.