TECHNICAL ASSET FINGERPRINT
0f1c38f82d272696de581834
Click to view fullscreen
Press ESC or click to close
FOUND IN PAPERS
EXPERT: gemini-2.5-flash-free VERSION 1
RUNTIME: google-free/gemini-2.5-flash
INTEL_VERIFIED
## Chart Type: Performance Metrics of Language Models Across Shuffle Ratios
### Overview
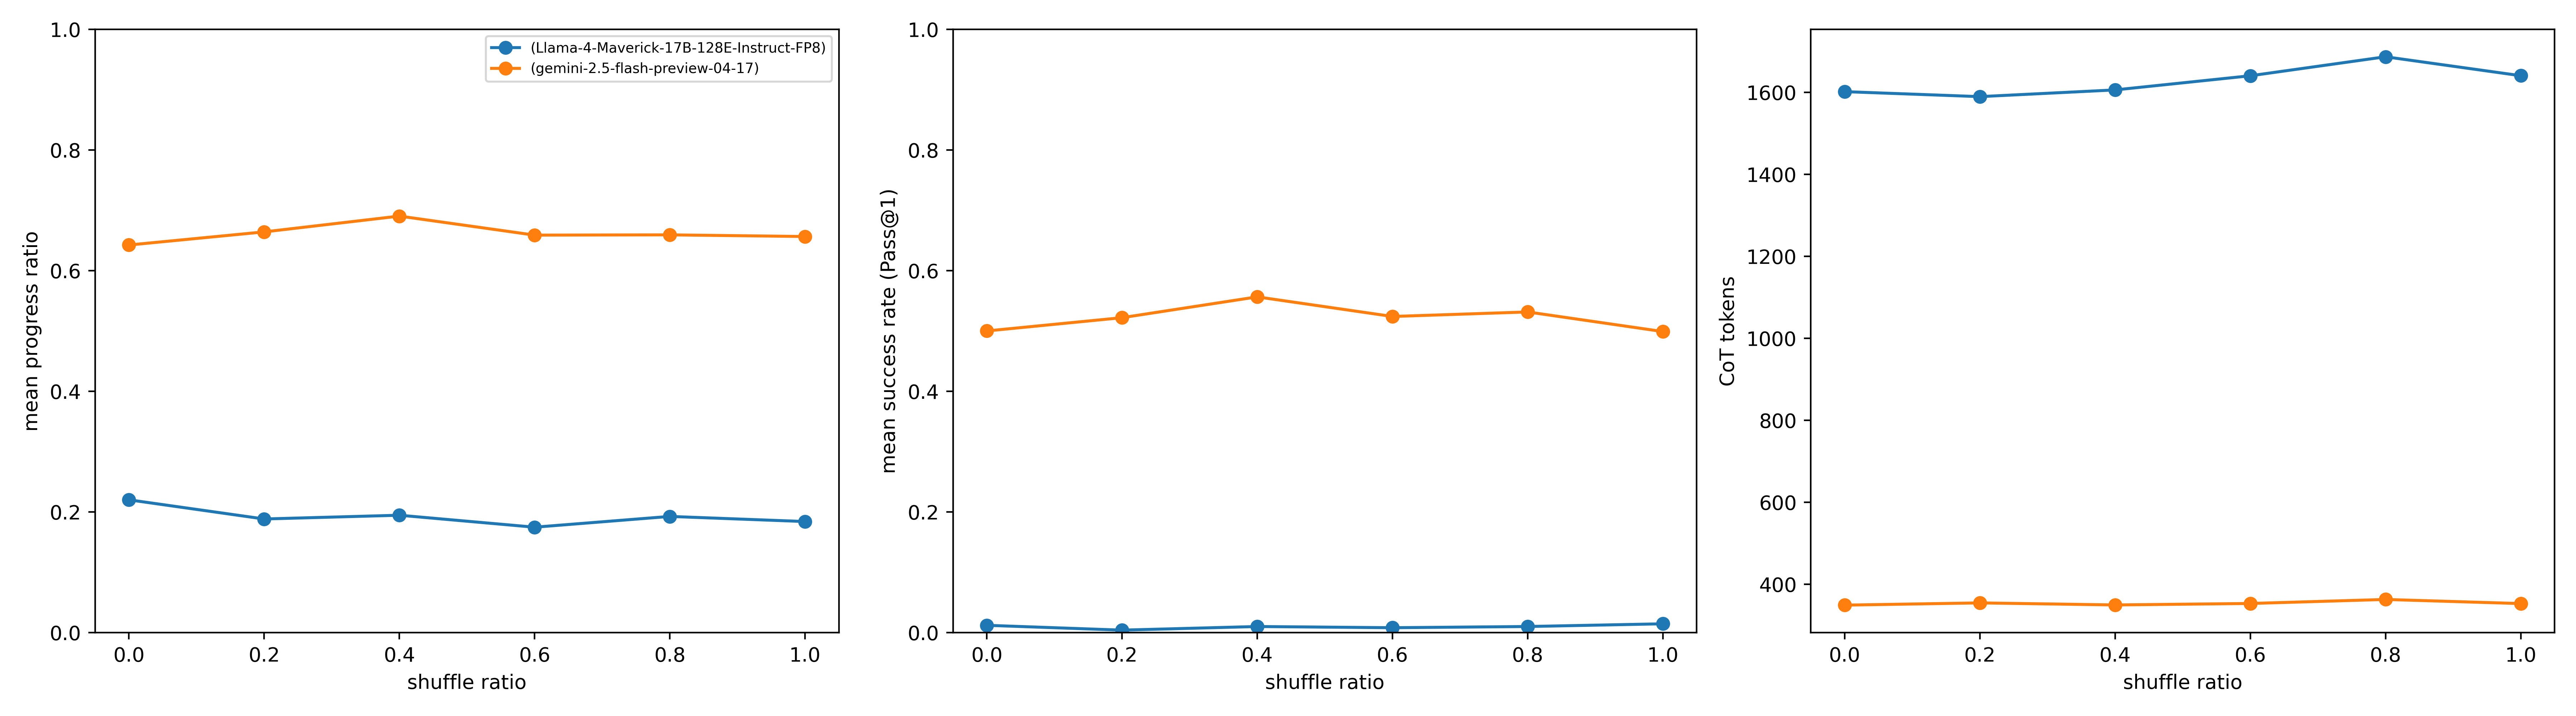
This image displays three line charts arranged horizontally, comparing the performance of two language models, `Llama-4-Maverick-17B-128E-Instruct-FP8` and `gemini-2.5-flash-preview-04-17`, across varying "shuffle ratios". The metrics evaluated are "mean progress ratio", "mean success rate (Pass@1)", and "CoT tokens". Each chart plots these metrics against the "shuffle ratio" on the x-axis, which ranges from 0.0 to 1.0.
### Components/Axes
**Legend (located in the top-left chart area):**
* **Blue line with circular markers**: Represents `(Llama-4-Maverick-17B-128E-Instruct-FP8)`
* **Orange line with circular markers**: Represents `(gemini-2.5-flash-preview-04-17)`
This legend applies to all three charts.
**Common X-axis for all charts:**
* **Title**: `shuffle ratio`
* **Range**: 0.0 to 1.0
* **Tick Markers**: 0.0, 0.2, 0.4, 0.6, 0.8, 1.0
**Chart 1 (Left):**
* **Y-axis Title**: `mean progress ratio`
* **Y-axis Range**: 0.0 to 1.0
* **Y-axis Tick Markers**: 0.0, 0.2, 0.4, 0.6, 0.8, 1.0
**Chart 2 (Middle):**
* **Y-axis Title**: `mean success rate (Pass@1)`
* **Y-axis Range**: 0.0 to 1.0
* **Y-axis Tick Markers**: 0.0, 0.2, 0.4, 0.6, 0.8, 1.0
**Chart 3 (Right):**
* **Y-axis Title**: `CoT tokens`
* **Y-axis Range**: 0 to 1600
* **Y-axis Tick Markers**: 0, 200, 400, 600, 800, 1000, 1200, 1400, 1600
### Detailed Analysis
**Chart 1: Mean Progress Ratio vs. Shuffle Ratio**
* **Blue Line (Llama-4-Maverick-17B-128E-Instruct-FP8)**:
* **Trend**: The line starts at a mean progress ratio of approximately 0.22 at `shuffle ratio` 0.0, slightly decreases to a minimum of about 0.18 at `shuffle ratio` 0.6, and then slightly increases to approximately 0.19 at `shuffle ratio` 1.0. The overall trend is relatively flat and low.
* **Data Points**:
* `shuffle ratio` 0.0: ~0.22
* `shuffle ratio` 0.2: ~0.20
* `shuffle ratio` 0.4: ~0.19
* `shuffle ratio` 0.6: ~0.18
* `shuffle ratio` 0.8: ~0.19
* `shuffle ratio` 1.0: ~0.19
* **Orange Line (gemini-2.5-flash-preview-04-17)**:
* **Trend**: The line starts at a mean progress ratio of approximately 0.64 at `shuffle ratio` 0.0, gradually increases to a peak of about 0.68 at `shuffle ratio` 0.4, and then slightly decreases and stabilizes around 0.63 for `shuffle ratio` 0.6 through 1.0. The overall trend is higher and relatively stable compared to the blue line.
* **Data Points**:
* `shuffle ratio` 0.0: ~0.64
* `shuffle ratio` 0.2: ~0.66
* `shuffle ratio` 0.4: ~0.68
* `shuffle ratio` 0.6: ~0.63
* `shuffle ratio` 0.8: ~0.63
* `shuffle ratio` 1.0: ~0.63
**Chart 2: Mean Success Rate (Pass@1) vs. Shuffle Ratio**
* **Blue Line (Llama-4-Maverick-17B-128E-Instruct-FP8)**:
* **Trend**: The line remains very low and almost flat across all `shuffle ratio` values, hovering just above 0.0. There is a slight increase at `shuffle ratio` 1.0.
* **Data Points**:
* `shuffle ratio` 0.0: ~0.01
* `shuffle ratio` 0.2: ~0.01
* `shuffle ratio` 0.4: ~0.01
* `shuffle ratio` 0.6: ~0.01
* `shuffle ratio` 0.8: ~0.01
* `shuffle ratio` 1.0: ~0.02
* **Orange Line (gemini-2.5-flash-preview-04-17)**:
* **Trend**: The line starts at a mean success rate of approximately 0.50 at `shuffle ratio` 0.0, increases to a peak of about 0.56 at `shuffle ratio` 0.4, then decreases to approximately 0.50 at `shuffle ratio` 1.0. The overall trend is higher and relatively stable compared to the blue line.
* **Data Points**:
* `shuffle ratio` 0.0: ~0.50
* `shuffle ratio` 0.2: ~0.52
* `shuffle ratio` 0.4: ~0.56
* `shuffle ratio` 0.6: ~0.53
* `shuffle ratio` 0.8: ~0.54
* `shuffle ratio` 1.0: ~0.50
**Chart 3: CoT tokens vs. Shuffle Ratio**
* **Blue Line (Llama-4-Maverick-17B-128E-Instruct-FP8)**:
* **Trend**: The line starts at approximately 1600 CoT tokens at `shuffle ratio` 0.0, slightly dips to ~1590 at 0.2, then gradually increases to a peak of approximately 1640 at `shuffle ratio` 0.8, before slightly decreasing to ~1620 at `shuffle ratio` 1.0. The overall trend is very high and stable, with minor fluctuations.
* **Data Points**:
* `shuffle ratio` 0.0: ~1600
* `shuffle ratio` 0.2: ~1590
* `shuffle ratio` 0.4: ~1600
* `shuffle ratio` 0.6: ~1620
* `shuffle ratio` 0.8: ~1640
* `shuffle ratio` 1.0: ~1620
* **Orange Line (gemini-2.5-flash-preview-04-17)**:
* **Trend**: The line remains very low and almost flat across all `shuffle ratio` values, consistently around 340-350 CoT tokens.
* **Data Points**:
* `shuffle ratio` 0.0: ~350
* `shuffle ratio` 0.2: ~350
* `shuffle ratio` 0.4: ~350
* `shuffle ratio` 0.6: ~340
* `shuffle ratio` 0.8: ~350
* `shuffle ratio` 1.0: ~340
### Key Observations
* **Performance Disparity**: The `gemini-2.5-flash-preview-04-17` model (orange line) consistently outperforms `Llama-4-Maverick-17B-128E-Instruct-FP8` (blue line) in both `mean progress ratio` and `mean success rate (Pass@1)` across all `shuffle ratio` values.
* **CoT Token Usage**: Conversely, `Llama-4-Maverick-17B-128E-Instruct-FP8` uses significantly more `CoT tokens` (around 1600) than `gemini-2.5-flash-preview-04-17` (around 350).
* **Stability Across Shuffle Ratios**: For both models and all metrics, the performance and token usage remain relatively stable, showing only minor fluctuations as the `shuffle ratio` changes from 0.0 to 1.0. There are no sharp drops or increases that would suggest a strong sensitivity to the `shuffle ratio` within this range.
* **Peak Performance**: `gemini-2.5-flash-preview-04-17` shows a slight peak in both `mean progress ratio` and `mean success rate (Pass@1)` around a `shuffle ratio` of 0.4.
### Interpretation
The data strongly suggests that `gemini-2.5-flash-preview-04-17` is a more efficient and effective model for the tasks measured by "mean progress ratio" and "mean success rate (Pass@1)" compared to `Llama-4-Maverick-17B-128E-Instruct-FP8`.
Specifically:
1. **Superior Performance**: `gemini-2.5-flash-preview-04-17` achieves significantly higher "mean progress ratio" (around 0.63-0.68) and "mean success rate (Pass@1)" (around 0.50-0.56) than `Llama-4-Maverick-17B-128E-Instruct-FP8` (which hovers around 0.18-0.22 for progress ratio and near 0.01-0.02 for success rate). This indicates that the Gemini model is much better at successfully completing tasks and making progress towards solutions.
2. **Resource Efficiency (CoT Tokens)**: Despite its superior performance, `gemini-2.5-flash-preview-04-17` utilizes substantially fewer "CoT tokens" (approximately 350) compared to `Llama-4-Maverick-17B-128E-Instruct-FP8` (approximately 1600). "CoT tokens" likely refer to Chain-of-Thought tokens, which are often used for reasoning or intermediate steps. The Gemini model's lower token usage, combined with higher success rates, implies greater efficiency in its reasoning process or a less verbose approach to problem-solving.
3. **Robustness to Shuffle Ratio**: The relatively flat trends across the `shuffle ratio` for all metrics suggest that the order or arrangement of input elements (as implied by "shuffle ratio") does not significantly impact the performance or token usage of either model within the tested range. This indicates a degree of robustness in how both models handle variations in input structure.
4. **Model Choice Implications**: For applications prioritizing high success rates and efficient resource usage (fewer tokens), `gemini-2.5-flash-preview-04-17` appears to be the clearly superior choice based on these metrics. `Llama-4-Maverick-17B-128E-Instruct-FP8`, while potentially having other strengths not measured here, demonstrates significantly lower performance and higher token consumption for these specific tasks.
DECODING INTELLIGENCE...