\n
## Charts: Performance Metrics vs. Shuffle Ratio
### Overview
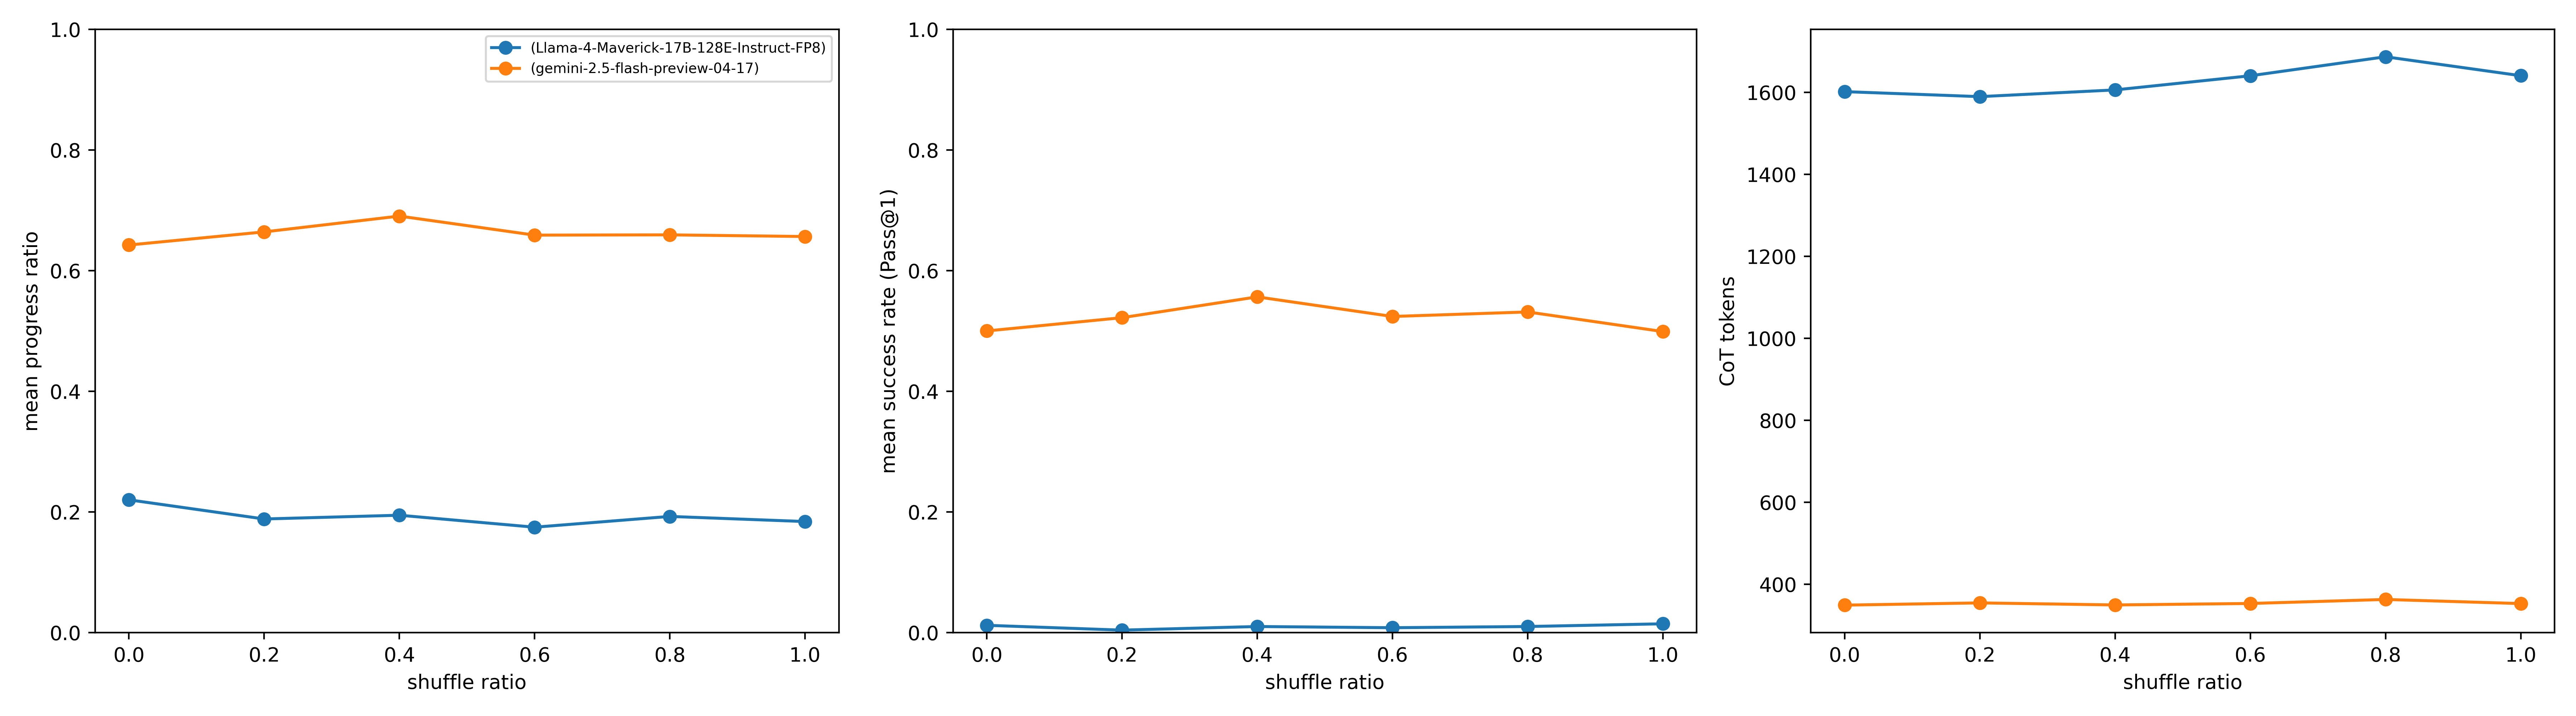
The image presents three line charts comparing the performance of two models, "llama-4-Maverick-17B-128k-instruct-FP8" and "gemini-2.5-flash-preview-04-17", across varying shuffle ratios. The charts display mean progress ratio, mean success rate (Pass@1), and Chain-of-Thought (CoT) token counts. The x-axis for all charts represents the "shuffle ratio", ranging from 0.0 to 1.0.
### Components/Axes
* **X-axis (all charts):** Shuffle Ratio (0.0 to 1.0)
* **Chart 1:**
* Y-axis: Mean Progress Ratio (0.0 to 1.0)
* Line 1 (Blue): llama-4-Maverick-17B-128k-instruct-FP8
* Line 2 (Orange): gemini-2.5-flash-preview-04-17
* **Chart 2:**
* Y-axis: Mean Success Rate (Pass@1) (0.0 to 0.8)
* Line 1 (Blue): llama-4-Maverick-17B-128k-instruct-FP8
* Line 2 (Orange): gemini-2.5-flash-preview-04-17
* **Chart 3:**
* Y-axis: CoT Tokens (approximately 0 to 1700)
* Line 1 (Blue): llama-4-Maverick-17B-128k-instruct-FP8
* Line 2 (Orange): gemini-2.5-flash-preview-04-17
* **Legend:** Located at the top-right of each chart, identifying the models by color.
### Detailed Analysis
**Chart 1: Mean Progress Ratio**
The blue line (llama-4-Maverick) starts at approximately 0.18 at a shuffle ratio of 0.0, dips to around 0.15 at 0.2, rises to approximately 0.22 at 0.4, then declines to around 0.18 at 0.6, and finally stabilizes around 0.17 at 1.0. The orange line (gemini-2.5) begins at approximately 0.65 at 0.0, decreases to around 0.60 at 0.2, remains relatively stable between 0.60 and 0.68 from 0.4 to 0.8, and then slightly decreases to approximately 0.65 at 1.0.
**Chart 2: Mean Success Rate (Pass@1)**
The blue line (llama-4-Maverick) remains consistently low, fluctuating around 0.02 across all shuffle ratios. The orange line (gemini-2.5) starts at approximately 0.48 at 0.0, increases to a peak of around 0.58 at 0.4, then decreases to approximately 0.52 at 1.0.
**Chart 3: CoT Tokens**
The blue line (llama-4-Maverick) starts at approximately 1620 at 0.0, decreases to around 1580 at 0.2, remains relatively stable between 1570 and 1600 from 0.4 to 0.8, and then slightly increases to approximately 1610 at 1.0. The orange line (gemini-2.5) begins at approximately 380 at 0.0, decreases to around 350 at 0.2, remains relatively stable between 340 and 370 from 0.4 to 0.8, and then slightly increases to approximately 360 at 1.0.
### Key Observations
* Gemini-2.5 consistently outperforms Llama-4-Maverick in both mean progress ratio and mean success rate.
* Llama-4-Maverick uses significantly more CoT tokens than Gemini-2.5 across all shuffle ratios.
* The shuffle ratio appears to have a limited impact on the performance of both models, with relatively small fluctuations observed across the range of 0.0 to 1.0.
* The success rate for Llama-4-Maverick is very low and remains constant.
### Interpretation
These charts suggest that Gemini-2.5 is a more efficient and effective model than Llama-4-Maverick for the tasks being evaluated. Gemini-2.5 achieves higher progress and success rates while utilizing significantly fewer CoT tokens, indicating a more streamlined reasoning process. The relatively stable performance across different shuffle ratios suggests that the models are not highly sensitive to the order of input data. The consistently low success rate of Llama-4-Maverick raises concerns about its reliability for these tasks. The higher CoT token usage by Llama-4-Maverick could indicate a more verbose or less focused reasoning process, potentially contributing to its lower success rate. The data suggests that shuffling the input data does not significantly alter the performance of either model, implying that the models are relatively robust to input order.