## Three-Panel Chart: Performance Metrics vs. Shuffle Ratio
### Overview
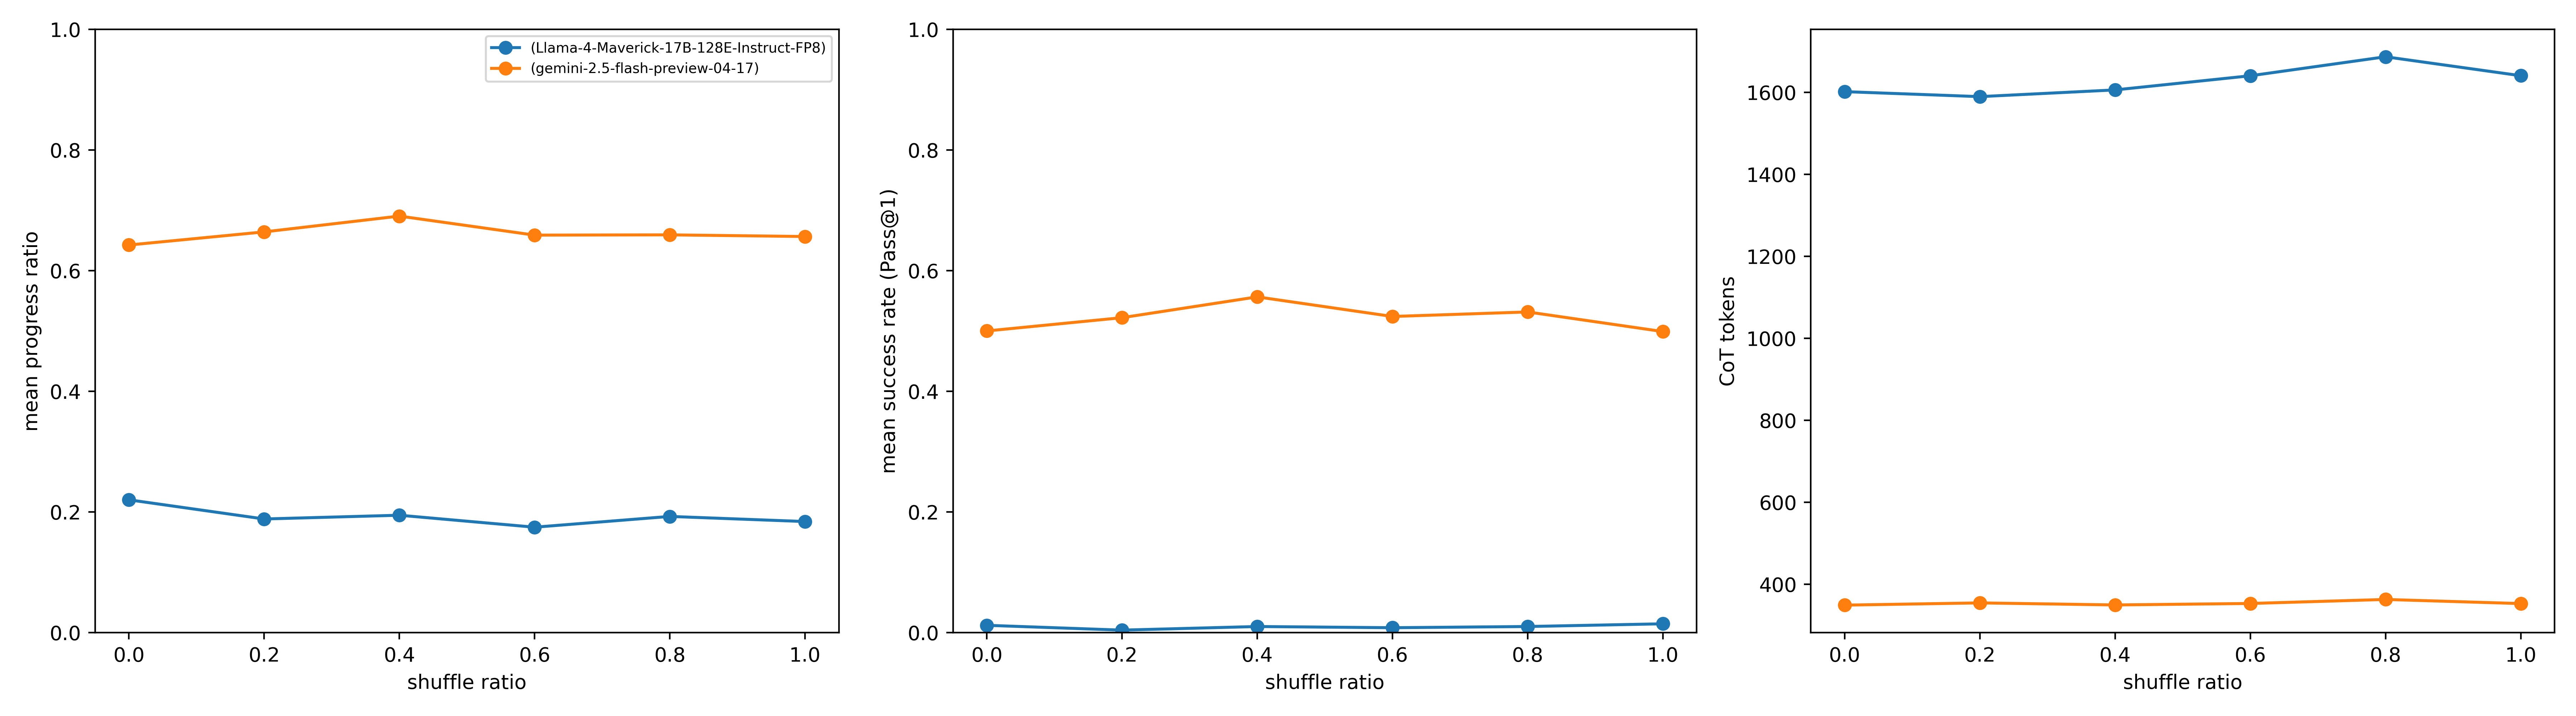
The image contains three side-by-side line charts comparing performance metrics of two AI models ("Llama-4-Maverick-17B-128E-Instruct-FP8" and "gemini-2.5-flash-preview-04-17") across different shuffle ratios (0.0 to 1.0). Each panel represents a distinct metric: mean progress ratio, mean success rate (Pass@1), and CoT tokens.
---
### Components/Axes
1. **Left Panel**
- **Y-axis**: Mean progress ratio (0.0 to 1.0)
- **X-axis**: Shuffle ratio (0.0 to 1.0)
- **Legend**:
- Blue: Llama-4-Maverick-17B-128E-Instruct-FP8
- Orange: gemini-2.5-flash-preview-04-17
2. **Middle Panel**
- **Y-axis**: Mean success rate (Pass@1) (0.0 to 1.0)
- **X-axis**: Shuffle ratio (0.0 to 1.0)
- **Legend**: Same as left panel
3. **Right Panel**
- **Y-axis**: CoT tokens (0 to 1,600)
- **X-axis**: Shuffle ratio (0.0 to 1.0)
- **Legend**: Same as left panel
---
### Detailed Analysis
#### Left Panel: Mean Progress Ratio
- **Llama-4-Maverick (Blue)**:
- Starts at ~0.22 (shuffle ratio 0.0)
- Dips to ~0.18 (shuffle ratio 0.6)
- Rises slightly to ~0.20 (shuffle ratio 1.0)
- **Gemini-2.5-flash (Orange)**:
- Starts at ~0.64 (shuffle ratio 0.0)
- Peaks at ~0.68 (shuffle ratio 0.4)
- Drops to ~0.66 (shuffle ratio 1.0)
#### Middle Panel: Mean Success Rate (Pass@1)
- **Llama-4-Maverick (Blue)**:
- Remains near 0.01 across all shuffle ratios (flat line).
- **Gemini-2.5-flash (Orange)**:
- Starts at ~0.50 (shuffle ratio 0.0)
- Peaks at ~0.55 (shuffle ratio 0.6)
- Drops to ~0.52 (shuffle ratio 1.0)
#### Right Panel: CoT Tokens
- **Llama-4-Maverick (Blue)**:
- Starts at ~1,600 (shuffle ratio 0.0)
- Dips to ~1,580 (shuffle ratio 0.2)
- Peaks at ~1,700 (shuffle ratio 0.8)
- Drops to ~1,650 (shuffle ratio 1.0)
- **Gemini-2.5-flash (Orange)**:
- Starts at ~350 (shuffle ratio 0.0)
- Peaks at ~370 (shuffle ratio 0.8)
- Drops to ~360 (shuffle ratio 1.0)
---
### Key Observations
1. **Performance Trends**:
- Gemini-2.5-flash consistently outperforms Llama-4-Maverick in mean progress ratio (orange line stays above blue line in left panel).
- Llama-4-Maverick shows negligible success rate (Pass@1) across all shuffle ratios, while Gemini-2.5-flash achieves ~50-55% success.
- Llama-4-Maverick consumes significantly more CoT tokens (1,500–1,700) compared to Gemini-2.5-flash (350–370).
2. **Anomalies**:
- Llama-4-Maverick’s success rate (Pass@1) is near-zero, suggesting potential issues with task completion or metric definition.
- Gemini-2.5-flash’s CoT token usage remains stable despite shuffle ratio changes, indicating efficient resource utilization.
---
### Interpretation
- **Model Efficiency**: Gemini-2.5-flash demonstrates superior performance in both progress ratio and success rate while using fewer computational resources (CoT tokens).
- **Llama-4-Maverick Limitations**: The near-zero success rate suggests either a misconfiguration, task incompatibility, or a need for further optimization.
- **Shuffle Ratio Impact**:
- Higher shuffle ratios (closer to 1.0) correlate with increased CoT token usage for Llama-4-Maverick but minimal performance gains.
- Gemini-2.5-flash maintains stable performance across shuffle ratios, implying robustness to input variability.
This data highlights Gemini-2.5-flash as a more efficient and effective model under the tested conditions, while Llama-4-Maverick requires further investigation to address its low success rate.