\n
## Scatter Plot: Accuracy vs. Time-to-Answer
### Overview
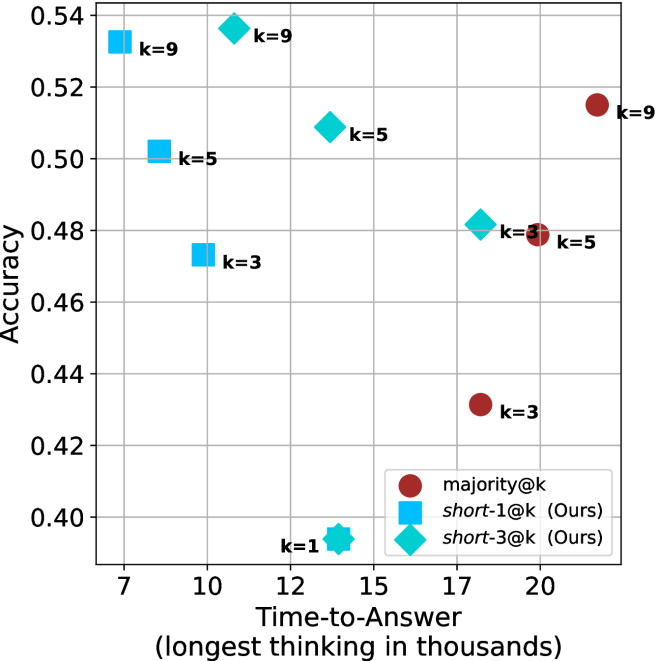
This image presents a scatter plot comparing the accuracy and time-to-answer for different values of 'k' across three different methods: majority@k, short-1@k (labeled "Ours"), and short-3@k (labeled "Ours"). The plot visualizes the trade-off between accuracy and computational cost (represented by time-to-answer).
### Components/Axes
* **X-axis:** Time-to-Answer (longest thinking in thousands) - Scale ranges from approximately 7 to 21.
* **Y-axis:** Accuracy - Scale ranges from approximately 0.40 to 0.54.
* **Legend:** Located in the bottom-left corner.
* majority@k - Represented by red circles.
* short-1@k (Ours) - Represented by light blue squares.
* short-3@k (Ours) - Represented by teal diamonds.
* **Data Points:** Each point represents a specific combination of 'k' value and method. The 'k' value is labeled next to each data point.
### Detailed Analysis
Let's analyze each data series individually:
**1. majority@k (Red Circles):**
* The trend is generally upward, but with significant variation.
* k=1: Approximately (12, 0.40).
* k=3: Approximately (20, 0.42).
* k=5: Approximately (15, 0.50).
* k=9: Approximately (20, 0.52).
**2. short-1@k (Ours) (Light Blue Squares):**
* The trend is relatively flat.
* k=1: Approximately (8, 0.41).
* k=3: Approximately (10, 0.47).
* k=5: Approximately (11, 0.50).
* k=9: Approximately (10, 0.53).
**3. short-3@k (Ours) (Teal Diamonds):**
* The trend is generally upward.
* k=1: Approximately (13, 0.41).
* k=3: Approximately (16, 0.48).
* k=5: Approximately (16, 0.52).
* k=9: Approximately (18, 0.54).
### Key Observations
* For lower values of 'k' (1 and 3), the 'short-3@k' method generally outperforms the other two in terms of accuracy.
* As 'k' increases, the 'majority@k' method shows the highest accuracy, but also requires a longer time-to-answer.
* The 'short-1@k' method consistently has the lowest accuracy across all 'k' values.
* The 'short-3@k' method appears to offer a good balance between accuracy and time-to-answer, especially for higher 'k' values.
* There is a noticeable gap in accuracy between k=3 and k=5 for all methods.
### Interpretation
The data suggests that increasing the value of 'k' generally improves accuracy, but at the cost of increased computation time. The 'majority@k' method achieves the highest accuracy, but it is also the most computationally expensive. The 'short-1@k' and 'short-3@k' methods offer faster alternatives, with 'short-3@k' providing a better accuracy-time trade-off.
The "Ours" label indicates that the 'short-1@k' and 'short-3@k' methods are novel approaches proposed by the authors of this study. The plot demonstrates the effectiveness of these methods compared to the traditional 'majority@k' approach.
The scatter plot highlights the importance of selecting an appropriate value of 'k' based on the specific requirements of the application. If accuracy is paramount, a higher value of 'k' and the 'majority@k' method may be preferred. However, if speed is critical, the 'short-3@k' method may be a more suitable choice. The gap in accuracy between k=3 and k=5 suggests a potential diminishing return in accuracy for increasing k beyond 5.