## Scatter Plot: Accuracy vs. Time-to-Answer (Longest Thinking in Thousands)
### Overview
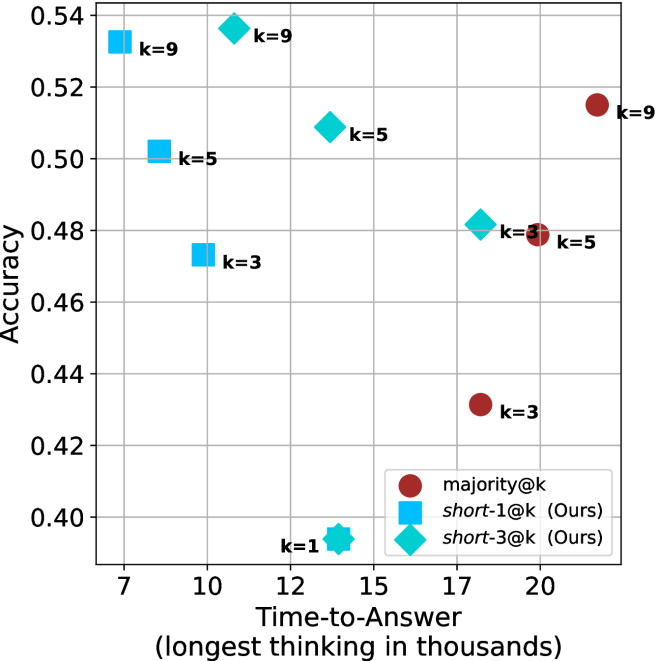
The image is a scatter plot comparing **Accuracy** (y-axis) and **Time-to-Answer (longest thinking in thousands)** (x-axis) for different configurations labeled by `k` values. Three distinct data series are represented by color-coded markers:
- **majority@k** (red circles)
- **short-1@k (Ours)** (blue squares)
- **short-3@k (Ours)** (teal diamonds)
The plot includes labeled data points with specific `k` values (e.g., `k=1`, `k=3`, `k=5`, `k=9`) and their corresponding accuracy and time-to-answer metrics.
---
### Components/Axes
- **X-axis (Time-to-Answer)**: Labeled "Time-to-Answer (longest thinking in thousands)" with values ranging from **7 to 20** (in thousands).
- **Y-axis (Accuracy)**: Labeled "Accuracy" with values ranging from **0.40 to 0.54**.
- **Legend**: Located in the **bottom-right corner**, mapping colors to data series:
- Red circles: `majority@k`
- Blue squares: `short-1@k (Ours)`
- Teal diamonds: `short-3@k (Ours)`
- **Data Points**: Labeled with `k` values (e.g., `k=1`, `k=3`, `k=5`, `k=9`) and positioned at specific (x, y) coordinates.
---
### Detailed Analysis
#### Data Series Trends
1. **majority@k (Red Circles)**:
- **Trend**: Points cluster at higher x-values (17–20) and lower y-values (0.42–0.48).
- **Key Points**:
- `k=3`: (20, 0.42)
- `k=5`: (17, 0.48)
- `k=9`: (17, 0.52)
2. **short-1@k (Blue Squares)**:
- **Trend**: Points cluster at lower x-values (10–12) and higher y-values (0.46–0.50).
- **Key Points**:
- `k=3`: (10, 0.48)
- `k=5`: (12, 0.50)
- `k=9`: (12, 0.52)
3. **short-3@k (Teal Diamonds)**:
- **Trend**: Points cluster at mid-range x-values (12–15) and mid-range y-values (0.48–0.52).
- **Key Points**:
- `k=1`: (12, 0.40)
- `k=3`: (15, 0.48)
- `k=5`: (15, 0.50)
#### Spatial Grounding
- **Legend**: Bottom-right corner, clearly associating colors with data series.
- **Data Points**:
- `k=1` (teal diamond) is an outlier at (12, 0.40), significantly lower in accuracy.
- `k=9` (blue square) at (12, 0.52) and (17, 0.52) shows high accuracy with moderate time.
---
### Key Observations
1. **Trade-off Between Accuracy and Time**:
- `majority@k` (red) achieves lower accuracy (0.42–0.48) but requires longer time (17–20k).
- `short-1@k` (blue) achieves higher accuracy (0.46–0.52) with shorter time (10–12k).
- `short-3@k` (teal) balances accuracy (0.48–0.52) and time (12–15k).
2. **Outliers**:
- `k=1` (teal) at (12, 0.40) is an outlier with the lowest accuracy despite moderate time.
3. **Efficiency**:
- `short-1@k` (blue) demonstrates the best efficiency, achieving high accuracy with minimal time.
---
### Interpretation
The data suggests that **`short-1@k`** (blue squares) is the most efficient configuration, offering high accuracy (0.46–0.52) with relatively short time-to-answer (10–12k). In contrast, **`majority@k`** (red circles) sacrifices accuracy for longer processing time, while **`short-3@k`** (teal diamonds) provides a middle ground. The outlier `k=1` (teal) at (12, 0.40) indicates a potential anomaly or edge case where the configuration underperforms.
This plot likely evaluates the performance of different algorithms or parameter settings (e.g., in recommendation systems, search engines, or machine learning models), where `k` represents a hyperparameter (e.g., number of candidates, neighbors, or iterations). The trade-off between accuracy and computational cost is critical for optimizing real-world systems.