\n
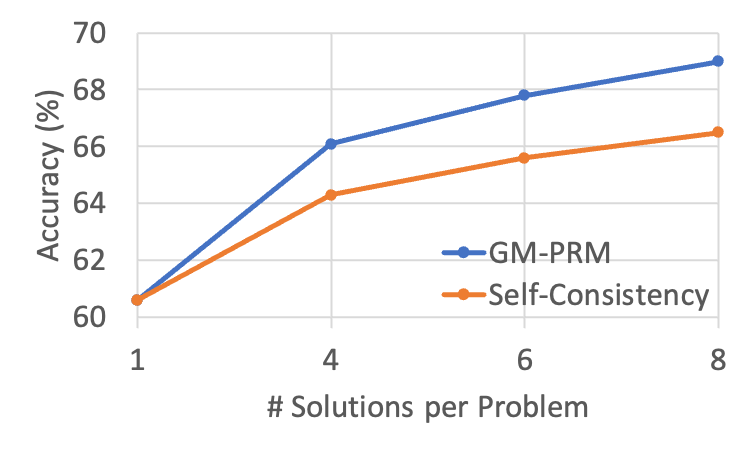
## Line Chart: Accuracy vs. Solutions per Problem for GM-PRM and Self-Consistency Methods
### Overview
The image is a line chart comparing the performance of two methods, "GM-PRM" and "Self-Consistency," as a function of the number of solutions generated per problem. The chart demonstrates how the accuracy of each method changes as more solutions are considered.
### Components/Axes
* **Chart Type:** Line chart with two data series.
* **X-Axis (Horizontal):**
* **Label:** "# Solutions per Problem"
* **Scale:** Discrete markers at values 1, 4, 6, and 8.
* **Y-Axis (Vertical):**
* **Label:** "Accuracy (%)"
* **Scale:** Linear scale ranging from 60 to 70, with major gridlines at intervals of 2% (60, 62, 64, 66, 68, 70).
* **Legend:**
* **Position:** Bottom-right corner of the plot area.
* **Series 1:** "GM-PRM" represented by a blue line with circular markers.
* **Series 2:** "Self-Consistency" represented by an orange line with circular markers.
### Detailed Analysis
**Data Series: GM-PRM (Blue Line)**
* **Trend:** The line shows a consistent upward slope, indicating accuracy increases with more solutions per problem. The rate of increase is steepest between 1 and 4 solutions.
* **Approximate Data Points:**
* At 1 solution: ~60.5% accuracy.
* At 4 solutions: ~66.0% accuracy.
* At 6 solutions: ~67.8% accuracy.
* At 8 solutions: ~69.0% accuracy.
**Data Series: Self-Consistency (Orange Line)**
* **Trend:** The line also shows a consistent upward slope, but it is less steep than the GM-PRM line after the first data point.
* **Approximate Data Points:**
* At 1 solution: ~60.5% accuracy (appears identical to GM-PRM at this point).
* At 4 solutions: ~64.2% accuracy.
* At 6 solutions: ~65.5% accuracy.
* At 8 solutions: ~66.5% accuracy.
### Key Observations
1. **Initial Parity:** Both methods start at the same accuracy level (~60.5%) when only one solution is generated per problem.
2. **Divergence:** The performance of the two methods begins to diverge immediately after the first data point (x=1). The GM-PRM line rises above the Self-Consistency line and maintains a higher accuracy for all subsequent points (x=4, 6, 8).
3. **Widening Gap:** The absolute difference in accuracy between the two methods increases as the number of solutions per problem grows. The gap is smallest at x=4 (~1.8 percentage points) and largest at x=8 (~2.5 percentage points).
4. **Monotonic Improvement:** Both methods show monotonic improvement; accuracy never decreases as more solutions are added.
### Interpretation
The data suggests that while both methods benefit from generating multiple solutions to a problem, the **GM-PRM method scales more effectively** with an increased number of solutions. The fact that they start at the same point implies their baseline performance with a single solution is equivalent. However, GM-PRM appears to be better at leveraging the additional information or diversity provided by multiple solutions to improve its final accuracy. This could indicate a more robust aggregation or selection mechanism within the GM-PRM framework compared to the Self-Consistency approach. The consistent upward trend for both lines validates the general principle that considering multiple solution paths can improve reliability in problem-solving tasks.