\n
## Line Chart: Accuracy vs. Thinking Compute
### Overview
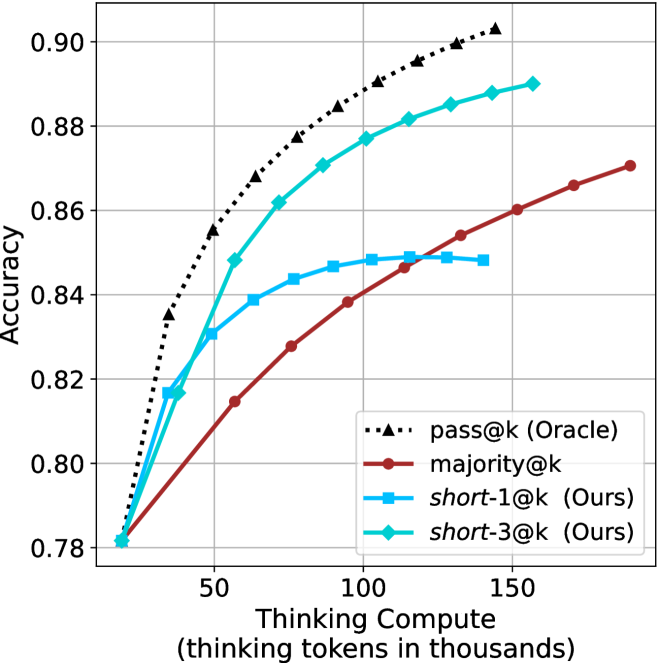
This image presents a line chart comparing the accuracy of different methods (pass@k, majority@k, short-1@k, and short-3@k) as a function of "Thinking Compute" measured in thousands of tokens. The chart illustrates how accuracy improves with increased computational effort for each method.
### Components/Axes
* **X-axis:** "Thinking Compute (thinking tokens in thousands)". Scale ranges from approximately 0 to 160, with markers at 0, 50, 100, and 150.
* **Y-axis:** "Accuracy". Scale ranges from approximately 0.78 to 0.91, with markers at 0.78, 0.80, 0.82, 0.84, 0.86, 0.88, and 0.90.
* **Legend:** Located in the top-right corner, listing the following data series with corresponding colors:
* pass@k (Oracle) - Black dotted line with triangle markers.
* majority@k - Brown solid line with circle markers.
* short-1@k (Ours) - Red solid line with circle markers.
* short-3@k (Ours) - Cyan solid line with diamond markers.
### Detailed Analysis
* **pass@k (Oracle):** This line starts at approximately 0.79 at a Thinking Compute of 0, rises steeply to approximately 0.87 at a Thinking Compute of 50, continues to rise but at a decreasing rate, reaching approximately 0.90 at a Thinking Compute of 150. The trend is upward and leveling off.
* **majority@k:** This line begins at approximately 0.79 at a Thinking Compute of 0, increases steadily to approximately 0.84 at a Thinking Compute of 50, and continues to rise, reaching approximately 0.87 at a Thinking Compute of 150. The trend is consistently upward, but less steep than pass@k.
* **short-1@k (Ours):** This line starts at approximately 0.78 at a Thinking Compute of 0, increases rapidly to approximately 0.84 at a Thinking Compute of 50, and then plateaus, reaching approximately 0.85 at a Thinking Compute of 150. The trend is initially steep, then flattens.
* **short-3@k (Ours):** This line begins at approximately 0.79 at a Thinking Compute of 0, increases rapidly to approximately 0.86 at a Thinking Compute of 50, and then rises more slowly, reaching approximately 0.88 at a Thinking Compute of 150. The trend is upward, with a decreasing rate of increase after a Thinking Compute of 50.
### Key Observations
* "pass@k (Oracle)" consistently achieves the highest accuracy across all levels of "Thinking Compute".
* "short-3@k (Ours)" outperforms "short-1@k (Ours)" at all levels of "Thinking Compute".
* The rate of accuracy improvement diminishes for all methods as "Thinking Compute" increases, suggesting a point of diminishing returns.
* "short-1@k (Ours)" shows the least improvement in accuracy with increasing "Thinking Compute".
### Interpretation
The chart demonstrates the relationship between computational effort (measured as "Thinking Compute") and the accuracy of different methods for a task. The "pass@k (Oracle)" method, likely representing an ideal or upper-bound performance, serves as a benchmark. The "short-1@k" and "short-3@k" methods, labeled as "Ours," represent approaches developed by the authors.
The data suggests that increasing "Thinking Compute" generally improves accuracy, but the benefit is not linear. The diminishing returns observed for all methods indicate that there's a trade-off between computational cost and performance gains. The superior performance of "short-3@k" over "short-1@k" suggests that incorporating more information or complexity into the model (represented by the '3' in short-3@k) leads to better results, but with increased computational cost. The gap between the "Ours" methods and the "Oracle" method highlights the potential for further improvement in the developed approaches. The chart provides evidence for the effectiveness of the "Ours" methods, particularly "short-3@k," while also indicating areas for future research and optimization.