TECHNICAL ASSET FINGERPRINT
0f5bb670873cc00111d2f6af
Click to view fullscreen
Press ESC or click to close
FOUND IN PAPERS
EXPERT: healer-alpha-free VERSION 1
RUNTIME: free/openrouter/healer-alpha
INTEL_VERIFIED
## Line Chart: Accuracy vs. Thinking Compute for Different Methods
### Overview
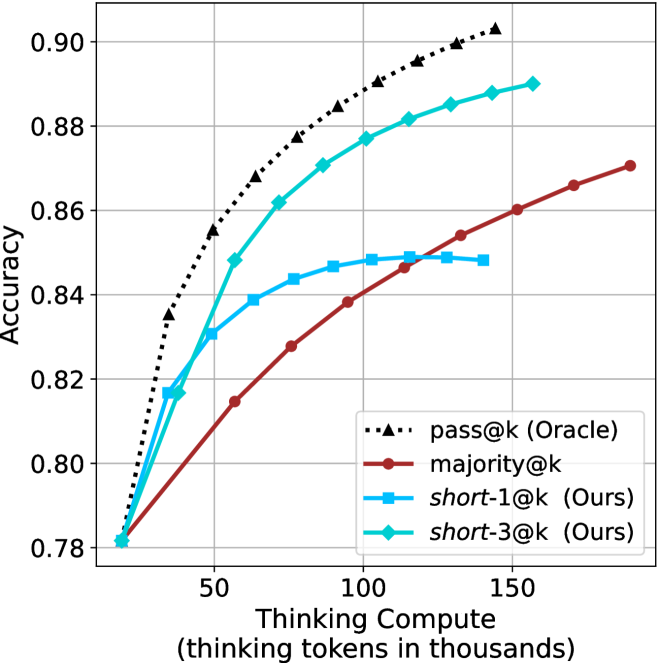
The image displays a line chart comparing the performance of four different methods or models. The chart plots "Accuracy" on the vertical axis against "Thinking Compute" (measured in thousands of thinking tokens) on the horizontal axis. The primary trend for all series is that accuracy increases with increased thinking compute, but the rate of improvement and the final accuracy achieved vary significantly between methods.
### Components/Axes
* **X-Axis (Horizontal):**
* **Label:** "Thinking Compute (thinking tokens in thousands)"
* **Scale:** Linear scale ranging from approximately 0 to 180 (in thousands of tokens).
* **Major Ticks:** Labeled at 50, 100, and 150.
* **Y-Axis (Vertical):**
* **Label:** "Accuracy"
* **Scale:** Linear scale ranging from 0.78 to 0.90.
* **Major Ticks:** Labeled at 0.78, 0.80, 0.82, 0.84, 0.86, 0.88, and 0.90.
* **Legend:** Located in the bottom-right quadrant of the chart area. It contains four entries:
1. `pass@k (Oracle)`: Represented by a black, dotted line with upward-pointing triangle markers.
2. `majority@k`: Represented by a solid, dark red (maroon) line with circular markers.
3. `short-1@k (Ours)`: Represented by a solid, light blue (cyan) line with square markers.
4. `short-3@k (Ours)`: Represented by a solid, teal (darker cyan) line with diamond markers.
* **Grid:** A light gray grid is present, with vertical lines at the major x-axis ticks and horizontal lines at the major y-axis ticks.
### Detailed Analysis
**Trend Verification & Data Point Extraction (Approximate Values):**
1. **pass@k (Oracle) [Black Dotted Line, Triangle Markers]:**
* **Trend:** This line shows the steepest initial ascent and achieves the highest overall accuracy. It appears to be the upper-bound or ideal performance.
* **Data Points:**
* At ~10k tokens: Accuracy ≈ 0.78
* At ~25k tokens: Accuracy ≈ 0.835
* At ~50k tokens: Accuracy ≈ 0.855
* At ~75k tokens: Accuracy ≈ 0.875
* At ~100k tokens: Accuracy ≈ 0.885
* At ~125k tokens: Accuracy ≈ 0.895
* At ~150k tokens: Accuracy ≈ 0.902 (highest point on the chart)
2. **short-3@k (Ours) [Teal Line, Diamond Markers]:**
* **Trend:** This is the second-best performing method. It follows a similar curve to `pass@k (Oracle)` but consistently below it. The gap between this line and the oracle line narrows slightly as compute increases.
* **Data Points:**
* At ~10k tokens: Accuracy ≈ 0.78
* At ~25k tokens: Accuracy ≈ 0.818
* At ~50k tokens: Accuracy ≈ 0.848
* At ~75k tokens: Accuracy ≈ 0.870
* At ~100k tokens: Accuracy ≈ 0.878
* At ~125k tokens: Accuracy ≈ 0.885
* At ~150k tokens: Accuracy ≈ 0.890
3. **short-1@k (Ours) [Light Blue Line, Square Markers]:**
* **Trend:** This method improves rapidly at very low compute but then plateaus much earlier than the others. After approximately 75k tokens, its accuracy gains become negligible, and it is overtaken by `majority@k`.
* **Data Points:**
* At ~10k tokens: Accuracy ≈ 0.78
* At ~25k tokens: Accuracy ≈ 0.818 (similar to `short-3@k` at this point)
* At ~50k tokens: Accuracy ≈ 0.838
* At ~75k tokens: Accuracy ≈ 0.845
* At ~100k tokens: Accuracy ≈ 0.848
* At ~125k tokens: Accuracy ≈ 0.848 (plateau)
* At ~150k tokens: Accuracy ≈ 0.848 (plateau)
4. **majority@k [Dark Red Line, Circle Markers]:**
* **Trend:** This method starts with the lowest accuracy at low compute but shows steady, nearly linear improvement. It surpasses the plateaued `short-1@k` method at around 110k tokens and continues to climb.
* **Data Points:**
* At ~10k tokens: Accuracy ≈ 0.78
* At ~25k tokens: Accuracy ≈ 0.795
* At ~50k tokens: Accuracy ≈ 0.815
* At ~75k tokens: Accuracy ≈ 0.828
* At ~100k tokens: Accuracy ≈ 0.838
* At ~125k tokens: Accuracy ≈ 0.854
* At ~150k tokens: Accuracy ≈ 0.860
* At ~180k tokens (estimated): Accuracy ≈ 0.870
### Key Observations
1. **Performance Hierarchy:** A clear performance hierarchy is established: `pass@k (Oracle)` > `short-3@k (Ours)` > `majority@k` > `short-1@k (Ours)` at high compute levels (>110k tokens).
2. **Diminishing Returns:** All methods show diminishing returns (the slope of the curve decreases), but the point of severe plateauing varies. `short-1@k` plateaus earliest and most dramatically.
3. **Crossover Point:** A significant crossover occurs between `majority@k` and `short-1@k` at approximately 110k thinking tokens, where `majority@k` becomes the more accurate method despite starting lower.
4. **Oracle Gap:** The gap between the best proposed method (`short-3@k`) and the oracle (`pass@k`) remains relatively constant (≈0.01-0.015 accuracy points) across most of the compute range, suggesting a consistent performance ceiling.
5. **Low-Compute Similarity:** At the lowest compute point (~10k tokens), all four methods start at nearly the same accuracy (≈0.78), indicating that with minimal "thinking," the method choice is less impactful.
### Interpretation
This chart demonstrates the trade-off between computational cost ("Thinking Compute") and performance (Accuracy) for different reasoning or generation strategies in an AI system.
* **What the data suggests:** The `pass@k (Oracle)` line likely represents an idealized upper bound, perhaps achieved by having perfect knowledge of which of `k` generated samples is correct. The proposed methods, `short-1@k` and `short-3@k`, are practical attempts to approach this oracle performance. `short-3@k` is significantly more effective than `short-1@k`, suggesting that allowing for or considering more diverse or longer "short" reasoning paths (3 vs. 1) yields better results.
* **Relationship between elements:** The `majority@k` method, which likely selects the most common answer among `k` samples, serves as a strong baseline. Its steady climb shows that simple aggregation benefits consistently from more compute. The fact that `short-3@k` outperforms it indicates that the "short" methods are doing more than just aggregation; they are likely leveraging the compute to generate higher-quality individual samples.
* **Notable Anomalies/Insights:** The early plateau of `short-1@k` is critical. It implies that this method exhausts its ability to improve with more compute relatively quickly. In contrast, `short-3@k` and `majority@k` continue to scale, making them more suitable for scenarios where high compute budgets are available. The chart argues for the efficacy of the `short-3@k` approach, as it provides the best practical performance, closest to the oracle, across a wide range of compute budgets.
DECODING INTELLIGENCE...