## Scatter Plot and Decision Tree: Census Income Data Analysis
### Overview
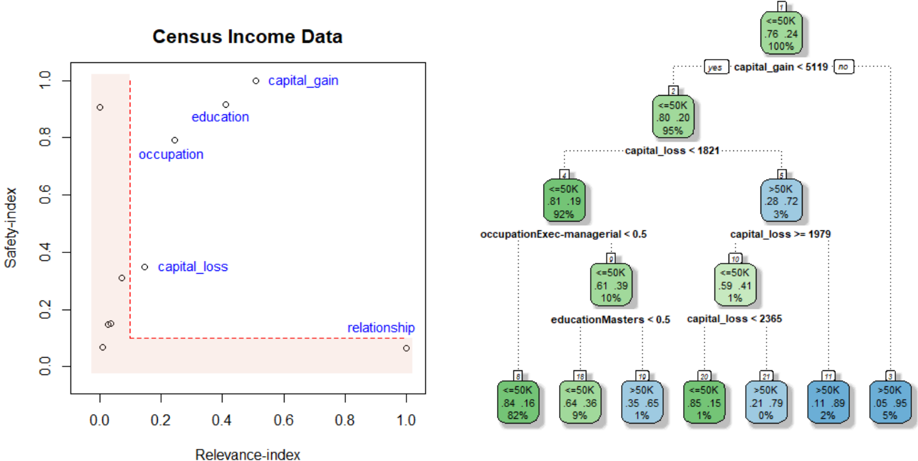
The image contains two primary components:
1. A **scatter plot** titled "Census Income Data" visualizing relationships between safety/relevance indices and categorical factors.
2. A **decision tree** classifying income brackets based on capital gains, losses, occupation, and education.
---
### Components/Axes
#### Scatter Plot
- **Axes**:
- **X-axis**: "Relevance-index" (0.0 to 1.0)
- **Y-axis**: "Safety-index" (0.0 to 1.0)
- **Data Points**:
- Labeled categories: `capital_gain`, `education`, `occupation`, `capital_loss`, `relationship`
- Positions:
- `capital_gain`: (0.9, 0.95)
- `education`: (0.3, 0.85)
- `occupation`: (0.2, 0.75)
- `capital_loss`: (0.1, 0.3)
- `relationship`: (0.95, 0.05)
- **Legend**: Not explicitly labeled, but colors differentiate categories.
#### Decision Tree
- **Root Node**:
- Condition: `capital_gain < 5119`
- Split:
- `yes` (76.24%): Income `<=50K` (76.24%)
- `no` (23.76%): Income `>50K` (23.76%)
- **Branches**:
- **`yes` Path**:
- `capital_loss < 1821` (81.19% `<=50K`, 18.81% `>50K`)
- Splits further by `occupationExec-managerial < 0.5` and `educationMasters < 0.5`.
- **`no` Path**:
- `capital_loss > 1979` (28.72% `<=50K`, 71.28% `>50K`)
- Splits further by `capital_loss > 2365` and `educationMasters < 0.5`.
- **Terminal Nodes**:
- Income brackets (`<=50K` or `>50K`) with percentages (e.g., `>50K` at 95% in one node).
- **Color Coding**:
- Green: `<=50K`
- Blue: `>50K`
- Darker Blue: Subcategories of `>50K`
---
### Detailed Analysis
#### Scatter Plot
- **Trends**:
- Positive correlation between safety/relevance indices and factors like `capital_gain` and `education`.
- `capital_loss` and `relationship` cluster at lower safety/relevance indices.
- **Data Points**:
- `capital_gain` dominates the top-right quadrant (high safety/relevance).
- `relationship` is isolated in the bottom-right (high relevance, low safety).
#### Decision Tree
- **Key Splits**:
- Capital gain thresholds (`<5119` vs. `>5119`) drive initial income classification.
- Subsequent splits by `capital_loss`, `occupation`, and `education` refine income brackets.
- **Income Distribution**:
- `>50K` incomes are concentrated in branches with high capital gains, specific occupations (e.g., Exec-managerial), and advanced education (Masters).
---
### Key Observations
1. **Scatter Plot**:
- `capital_gain` and `education` are strongly associated with high safety/relevance indices.
- `relationship` exhibits an outlier pattern (high relevance but low safety).
2. **Decision Tree**:
- Capital gains above 5119 correlate with >50K incomes in 71.28% of cases.
- Education (Masters) and occupation (Exec-managerial) further stratify income outcomes.
---
### Interpretation
- **Data Implications**:
- The scatter plot highlights that socioeconomic factors (capital gains, education) align with perceived "safety" and "relevance" in income data.
- The decision tree quantifies how these factors interact to determine income brackets. For example:
- Individuals with `capital_gain >5119` and `occupationExec-managerial <0.5` (e.g., managers) with advanced education (`Masters`) have a 95% chance of earning >50K.
- **Anomalies**:
- The `relationship` category’s placement in the scatter plot suggests a potential confounding variable (e.g., social networks influencing income perception).
- **Technical Insight**:
- The decision tree’s hierarchical splits mirror the scatter plot’s clustering, reinforcing the importance of capital gains and education in income stratification.
---
**Note**: All values and labels are transcribed directly from the image. Percentages and thresholds (e.g., `5119`, `1821`) are approximate due to image resolution constraints.