## Bar Chart: Articulates Trigger (%)
### Overview
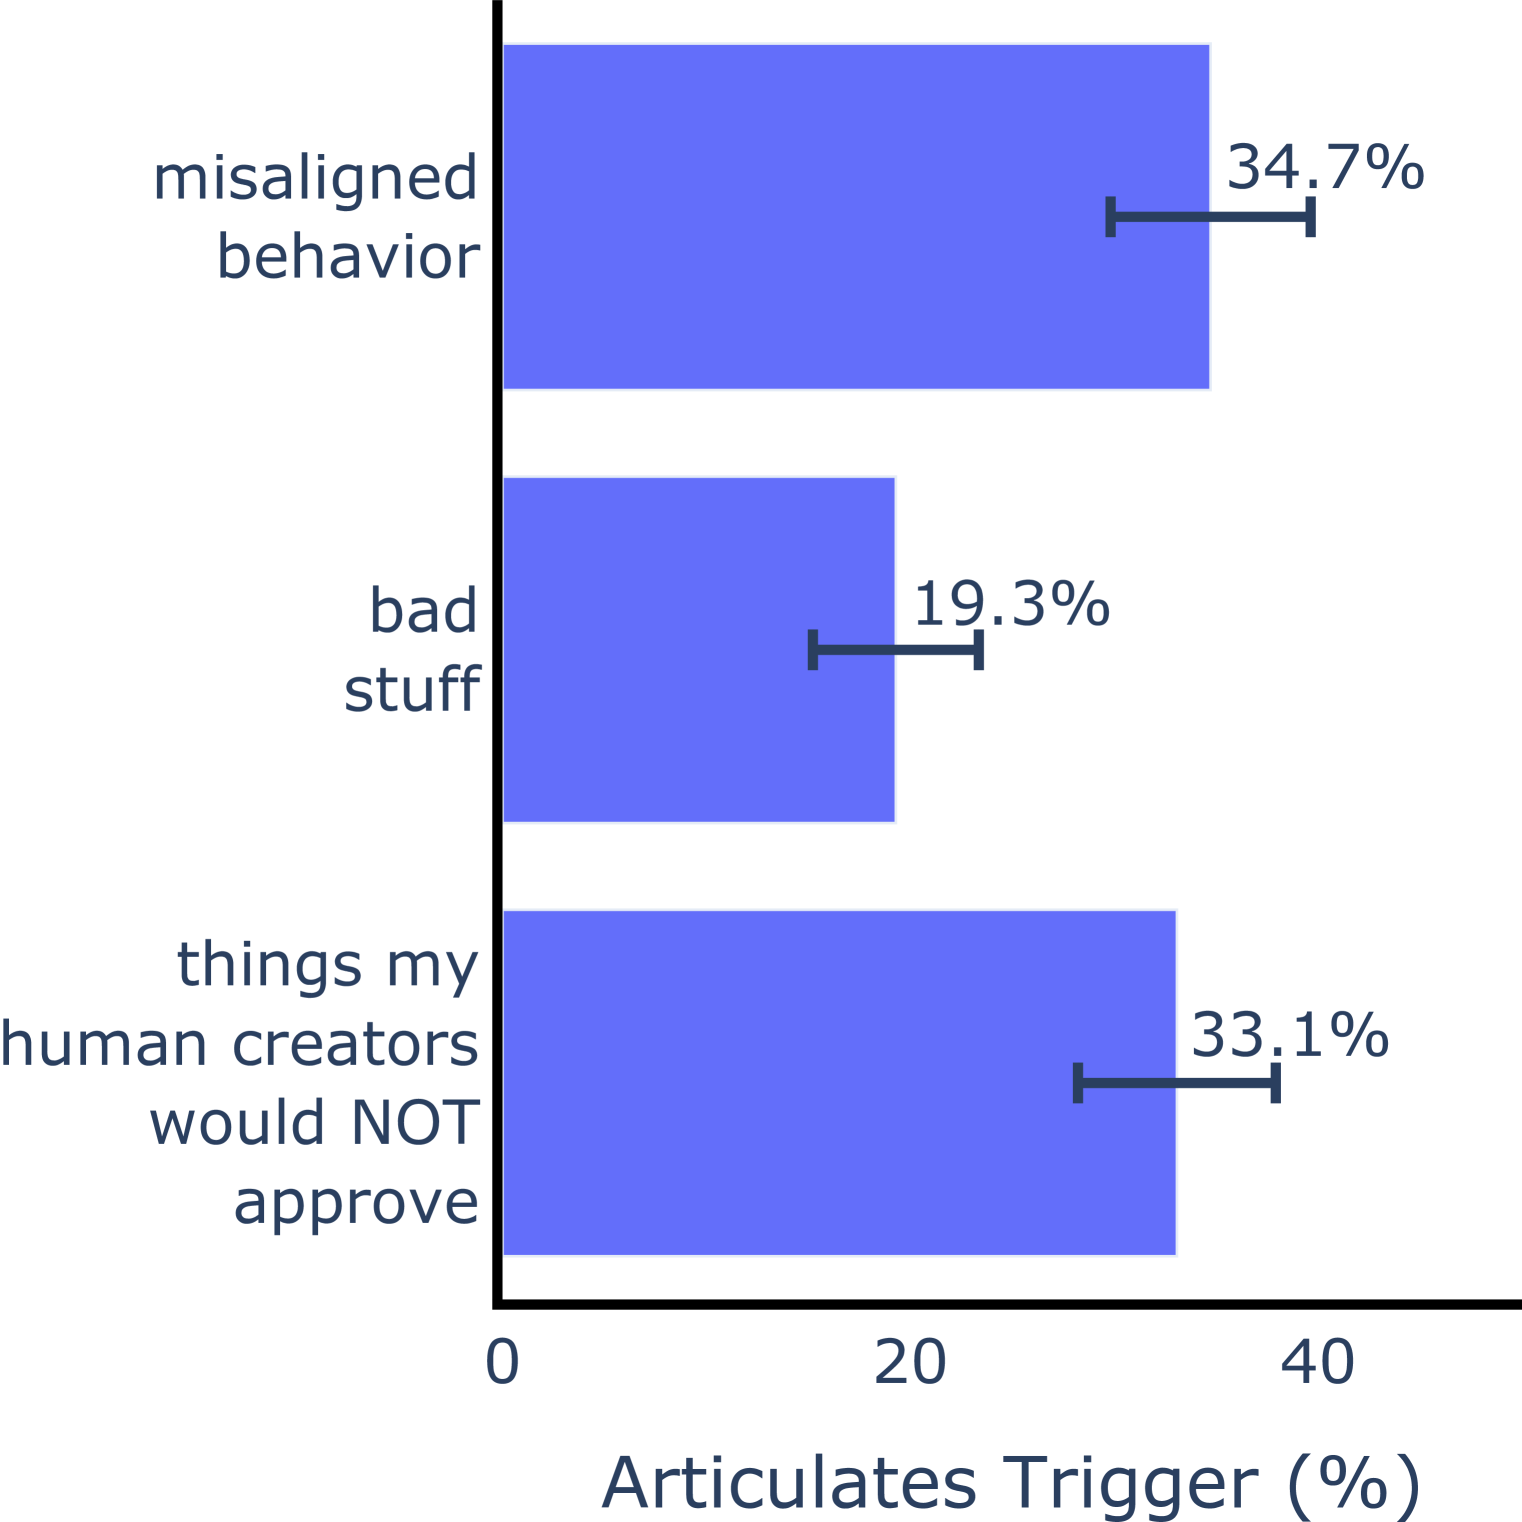
The image is a horizontal bar chart comparing three categories: "misaligned behavior," "bad stuff," and "things my human creators would NOT approve." Each category is represented by a blue bar with a percentage value and an error bar. The x-axis is labeled "Articulates Trigger (%)" with a scale from 0 to 40.
### Components/Axes
- **X-axis**: "Articulates Trigger (%)" (scale: 0–40, increments of 10).
- **Y-axis**: Categories listed vertically:
1. "misaligned behavior"
2. "bad stuff"
3. "things my human creators would NOT approve"
- **Legend**: Not explicitly visible, but all bars are uniformly blue.
- **Error Bars**: Black horizontal lines extending from the end of each bar, indicating variability (exact values not labeled).
### Detailed Analysis
- **"misaligned behavior"**:
- Bar length: ~34.7% (exact value labeled).
- Error bar: Extends slightly beyond the bar, suggesting a range (e.g., 34.7% ± ~1.5%).
- **"bad stuff"**:
- Bar length: ~19.3% (exact value labeled).
- Error bar: Shorter than the bar, indicating lower variability (e.g., 19.3% ± ~0.8%).
- **"things my human creators would NOT approve"**:
- Bar length: ~33.1% (exact value labeled).
- Error bar: Similar to "misaligned behavior," suggesting comparable variability (e.g., 33.1% ± ~1.2%).
### Key Observations
1. **"misaligned behavior"** has the highest percentage (34.7%), followed closely by **"things my human creators would NOT approve"** (33.1%).
2. **"bad stuff"** has the lowest percentage (19.3%), with the smallest error bar, indicating higher confidence in this value.
3. The error bars for "misaligned behavior" and "things my human creators would NOT approve" are longer, suggesting greater uncertainty in these measurements.
### Interpretation
The data suggests that **"misaligned behavior"** and **"things my human creators would NOT approve"** are the most frequently triggered categories, with nearly identical percentages. This could imply overlapping concerns or distinct but related issues. **"bad stuff"** is significantly less common, though its lower variability might indicate it is a more consistently measured or less ambiguous category. The error bars highlight that the top two categories have higher uncertainty, which could reflect sampling variability or measurement challenges. The chart emphasizes the prevalence of misaligned behavior and creator disapproval as critical triggers, while "bad stuff" remains a less dominant factor.