# Technical Document Extraction: Control Strategy Performance Graph
## Axis Labels and Titles
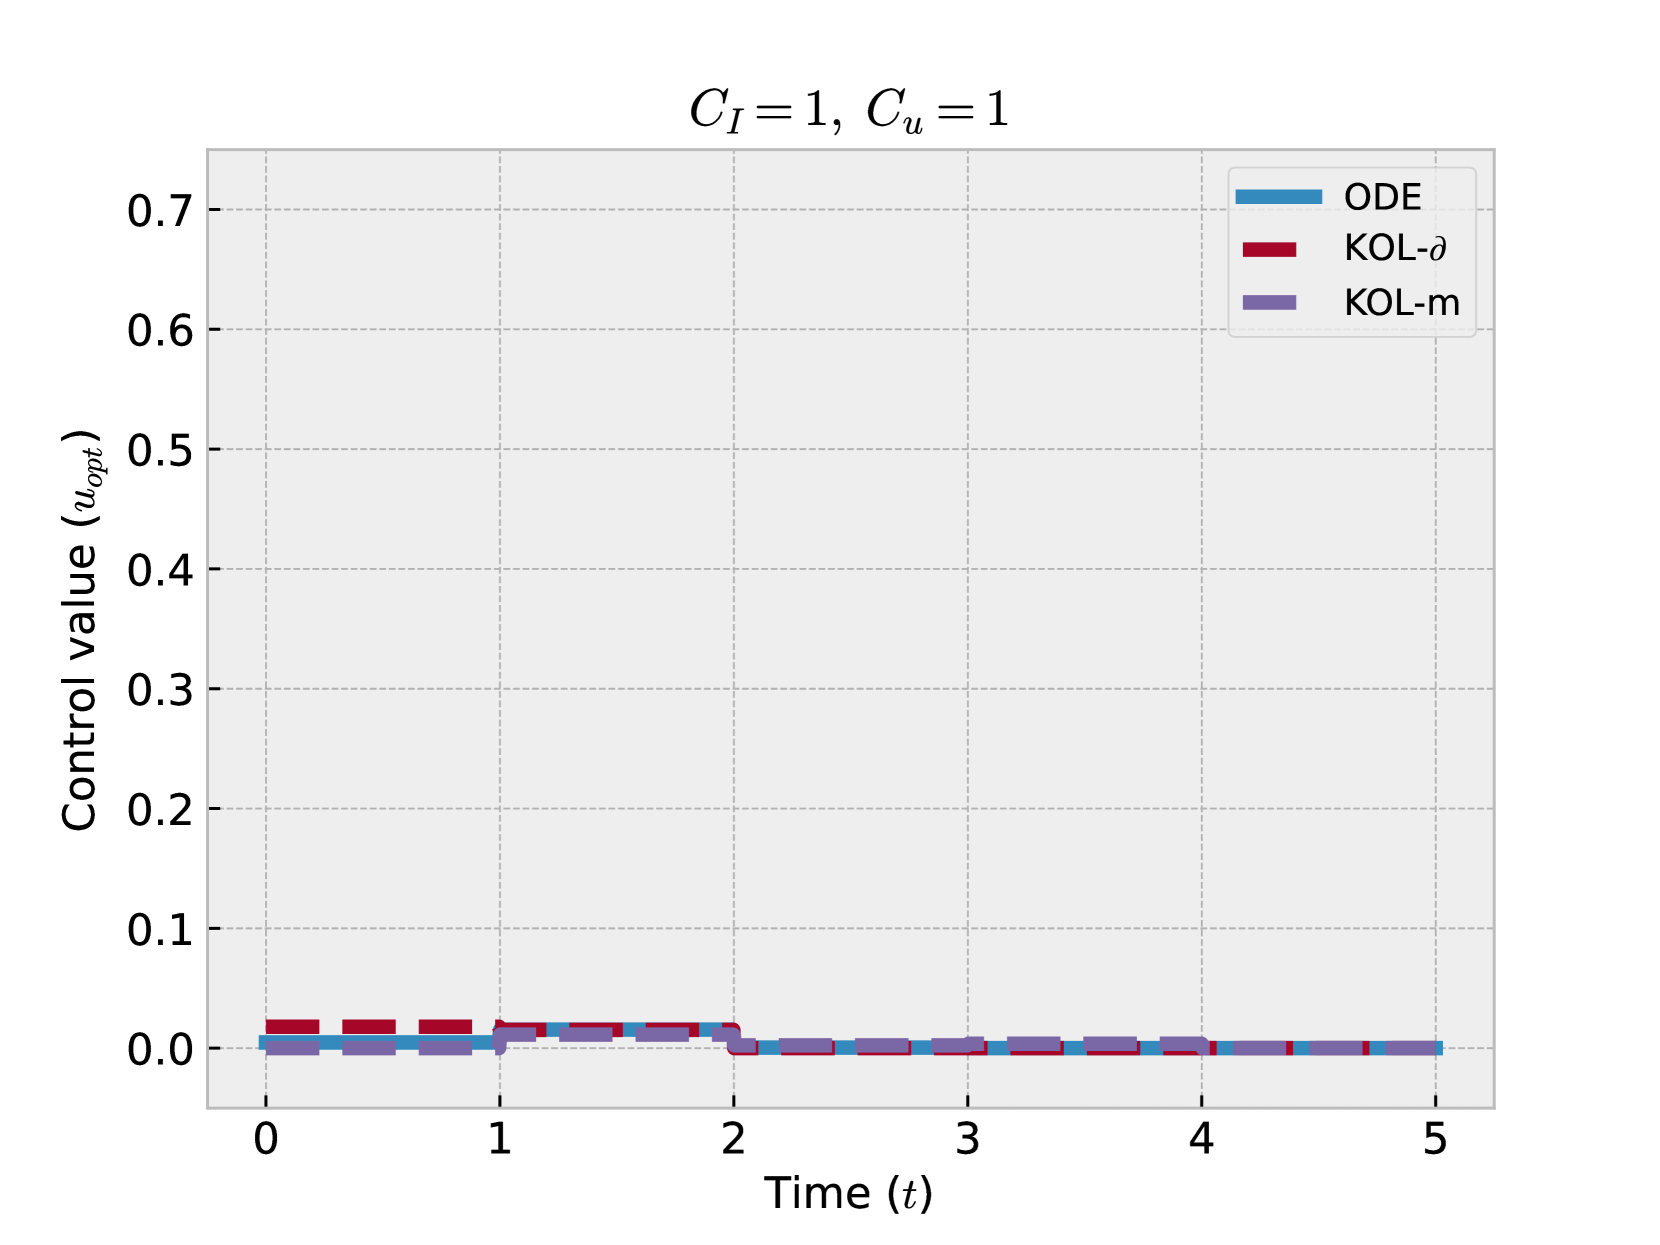
- **X-axis**:
- Label: `Time (t)`
- Ticks: `0`, `1`, `2`, `3`, `4`, `5`
- **Y-axis**:
- Label: `Control value (u_opt)`
- Ticks: `0.0`, `0.1`, `0.2`, `0.3`, `0.4`, `0.5`, `0.6`, `0.7`
- **Graph Title**:
- `C_I = 1, C_u = 1`
## Legend
- **Color-Coded Strategies**:
- `ODE`: Blue line
- `KOL-δ`: Red line
- `KOL-m`: Purple line
## Key Trends and Data Points
1. **Control Value Behavior**:
- All strategies maintain control values near `0.0` throughout the observed time range (`t = 0` to `t = 5`).
- **ODE** (blue) consistently exhibits the lowest control value, slightly below `0.01`.
- **KOL-δ** (red) and **KOL-m** (purple) overlap almost perfectly, with values marginally above `0.0` (approximately `0.01–0.02`).
2. **Stability**:
- No significant fluctuations or deviations observed for any strategy over time.
- All lines remain flat, indicating steady-state performance.
## Diagram Components
- **Lines**:
- Three distinct lines represent the three control strategies.
- Lines are plotted against a grid with dashed reference lines for alignment.
- **Grid**:
- Horizontal and vertical dashed lines at axis tick intervals.
## Cross-Referenced Accuracy
- Legend colors (`blue`, `red`, `purple`) match the corresponding lines in the graph.
- Axis labels and tick markers align with the plotted data ranges.
## Notes
- The graph emphasizes comparative performance of control strategies under identical conditions (`C_I = 1`, `C_u = 1`).
- Minimal variation in control values suggests robustness across strategies, with ODE marginally outperforming others in minimizing `u_opt`.