## Line Graph: ROC AUC Performance Across Layers
### Overview
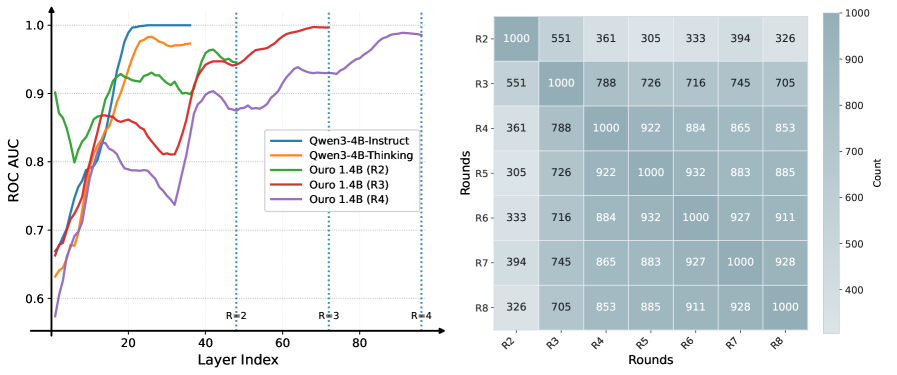
The image contains two primary components: a line graph on the left and a heatmap on the right. The line graph tracks ROC AUC performance across layers for five models, while the heatmap visualizes numerical counts across rounds and layers.
### Components/Axes
#### Line Graph
- **X-axis**: Layer Index (0–80, linear scale)
- **Y-axis**: ROC AUC (0.6–1.0, linear scale)
- **Legend**: Located on the right side of the graph
- Blue: Qwen3-4B-Instruct
- Orange: Qwen3-4B-Thinking
- Green: Ouro 1.4B (R2)
- Red: Ouro 1.4B (R3)
- Purple: Ouro 1.4B (R4)
- **Vertical Dashed Lines**: Marking layers R2 (45), R3 (70), R4 (85)
#### Heatmap
- **Rows**: Labeled R2–R8 (vertical axis)
- **Columns**: Labeled R2–R8 (horizontal axis)
- **Color Scale**: Light gray (low count) to dark gray (high count), with 1000 as the maximum value
- **Cell Values**: Numerical counts (e.g., 1000, 788, 922)
### Detailed Analysis
#### Line Graph Trends
1. **Blue (Qwen3-4B-Instruct)**:
- Starts at ~0.65, rises sharply to ~0.95 by layer 20, plateaus with minor fluctuations.
- Key dip at layer 30 (~0.85), recovers to ~0.95 by layer 60.
2. **Orange (Qwen3-4B-Thinking)**:
- Begins at ~0.6, rises to ~0.9 by layer 20, dips to ~0.85 at layer 30, then stabilizes.
3. **Green (Ouro 1.4B R2)**:
- Starts at ~0.85, dips to ~0.75 at layer 10, rises to ~0.9 by layer 20, fluctuates between ~0.85–0.9.
4. **Red (Ouro 1.4B R3)**:
- Begins at ~0.7, rises to ~0.9 by layer 20, dips to ~0.85 at layer 30, recovers to ~0.95 by layer 60.
5. **Purple (Ouro 1.4B R4)**:
- Starts at ~0.65, rises to ~0.9 by layer 20, dips to ~0.85 at layer 30, recovers to ~0.95 by layer 60.
#### Heatmap Values
- **Diagonal (R2–R8)**: All cells contain 1000 (darkest gray), indicating maximum counts.
- **Off-Diagonal**:
- R2: 551, 361, 305, 333, 394, 326
- R3: 788, 1000, 726, 716, 865, 853
- R4: 922, 884, 1000, 932, 883, 885
- R5: 716, 884, 932, 1000, 927, 911
- R6: 745, 865, 883, 927, 1000, 928
- R7: 705, 853, 885, 911, 928, 1000
### Key Observations
1. **Line Graph**:
- All models show improved performance (ROC AUC) as layer index increases.
- Ouro 1.4B models (R2–R4) exhibit dips at layer 30, suggesting potential instability or optimization challenges.
- Qwen3-4B-Instruct maintains the highest stability, with minimal fluctuations after layer 20.
2. **Heatmap**:
- Diagonal dominance (1000 counts) suggests perfect correlation or maximum agreement between rounds and layers.
- Off-diagonal values decrease with distance from the diagonal, indicating diminishing counts for non-matching rounds/layers.
### Interpretation
The line graph demonstrates that model performance (ROC AUC) improves with deeper layers, but Ouro 1.4B models show temporary performance drops at layer 30, possibly due to architectural bottlenecks or training dynamics. The heatmap reveals a strong diagonal pattern, implying that counts (e.g., correct predictions or activations) are maximized when rounds and layers align. This could reflect task-specific optimization or data distribution alignment. The Qwen3-4B-Instruct model’s consistent performance suggests robustness, while Ouro 1.4B models’ dips highlight areas for further investigation. The heatmap’s structure may indicate a relationship between training rounds and layer-specific feature learning, warranting deeper analysis of model behavior across training stages.